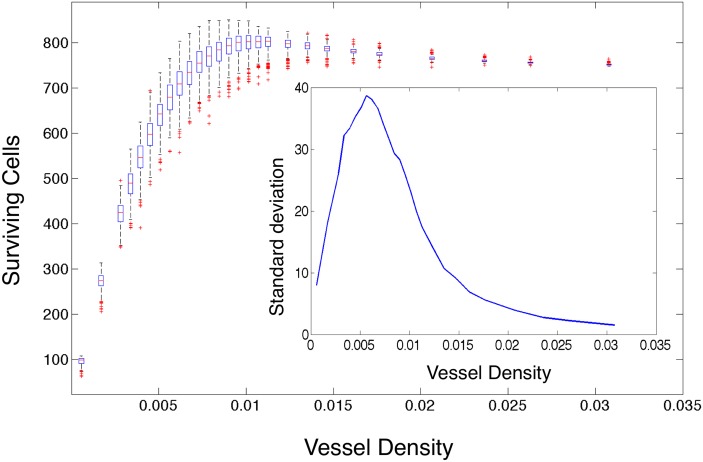
Fig 7. Surviving cells versus vessel density for all simulations.
We plot the number of surviving cells after 2Gy of simulated radiation in each simulation as calculated using Eq (5) modified by the OER from Eqs (6) and (7) versus the number of vessels in each case for each of the 500 simulations with constant vessel number, but random placement, on domain size 73 × 73 at dynamic equilibrium. The edges of the boxes represent the 25th and 75th percentiles, the whiskers extend to the most extreme data points not considered outliers. Outliers are defined as any simulation outside approximately 2.7 standard deviations, and they are plotted as red crosses. Inset we plot the standard deviation for each family of simulations versus the vessel number.

