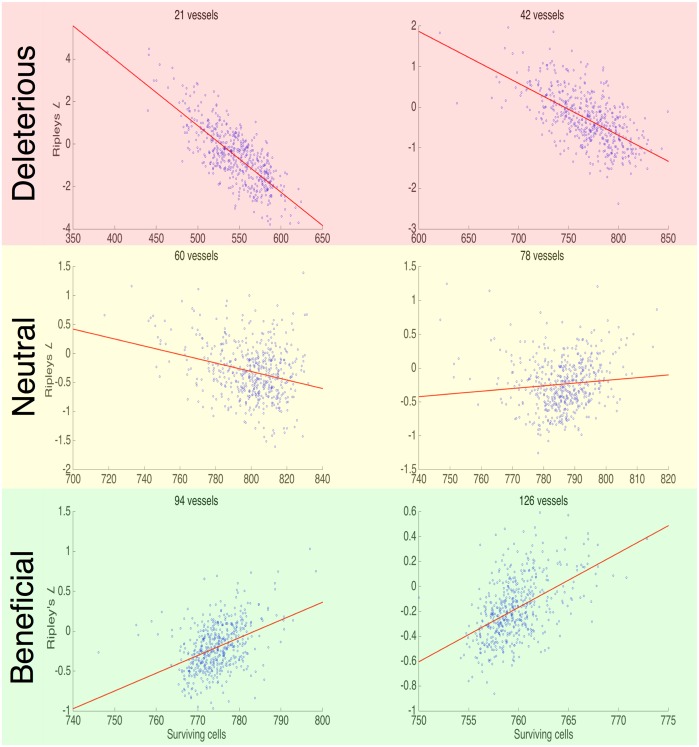
Fig 8. Ripley’s L function versus surviving cells after radiation.
We present six scatter plots showing the relationship in each of the 500 simulations represented in Fig 5 for a given initial vessel density between cell number surviving after 2 Gy of radiation (x-axis) and the mean of Ripley’s L function (y-axis). We find that there is a positive correlation in the low vessel densities, and a negative correlation in the high vessel densities. All correlations are significant (p ≪ 0.05, see Fig D in S1 Text).

