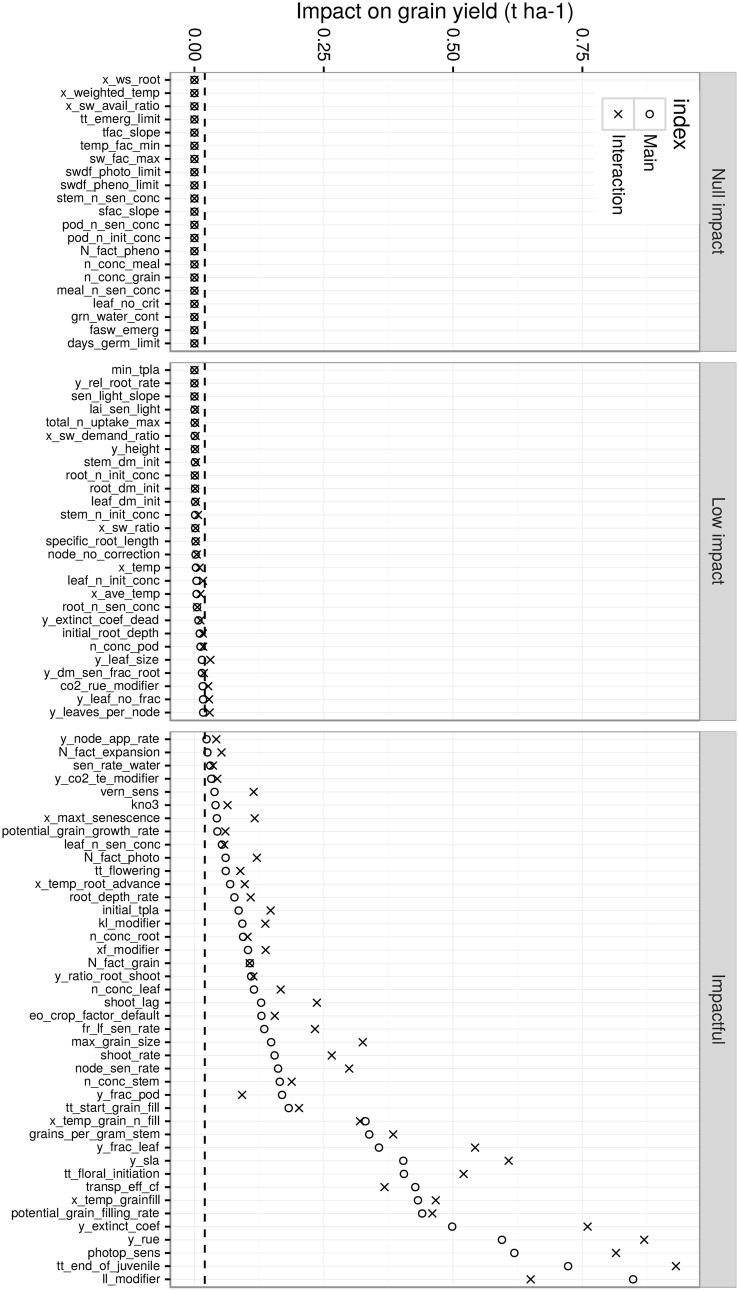
Fig 4. Screening for influential traits in the TPE (control conditions).
Traits were ranked by increasing mean main sensitivity index and were grouped into three groups (panels): null impact, low impact and impactful group. Note that all impacts are positive, as given by the sensitivity analysis method. A description of traits is presented in S1 Table. Concerning sensitivity indexes, the main effect (circle) is an estimation of the linear influence of the considered trait on grain yield, while the interaction effect (cross) is an estimation of non-linear and/or interaction effect(s) of the trait. The horizontal dashed line corresponds to the 20 kg ha-1 threshold above which traits are considered as impactful.

