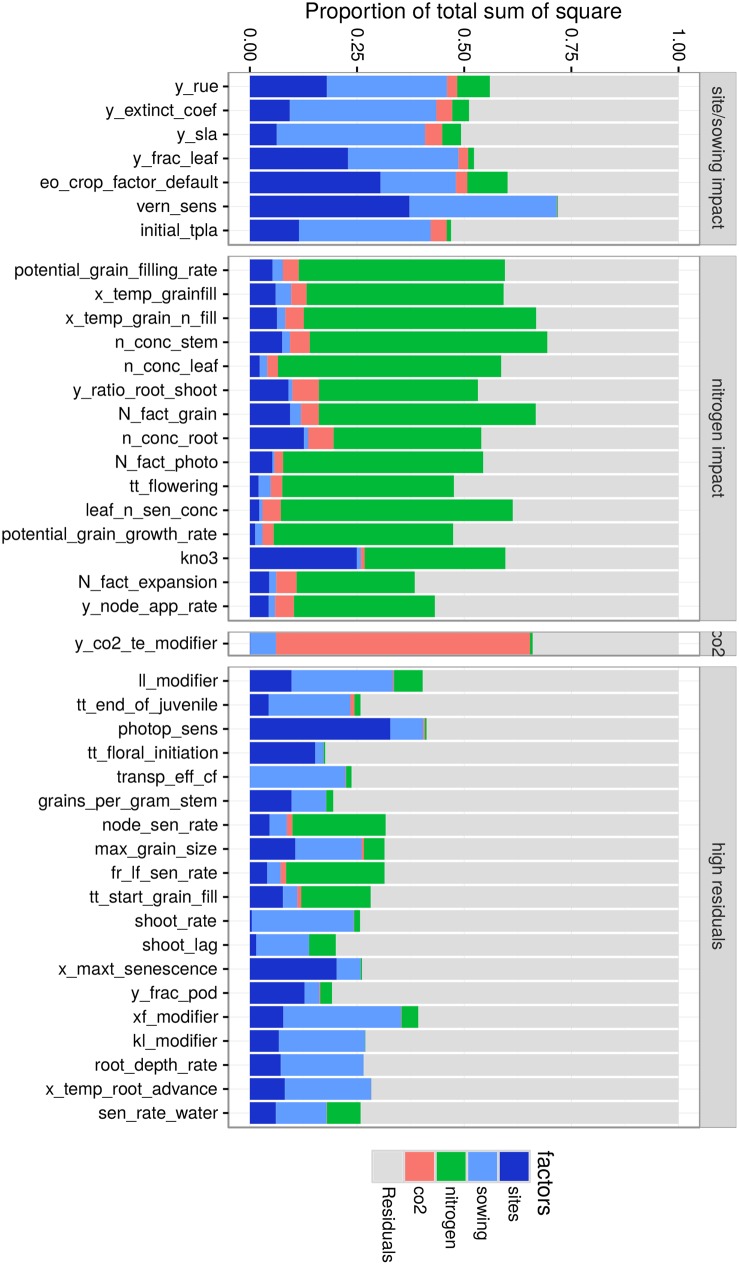
Fig 7. Variance components of trait main impact for major environmental factors.
For each influential trait, the proportion of variance explained by environmental factors (site, nitrogen fertilization, sowing date and CO2 level) was calculated in an ANOVA on simulated yield for crops in the 9000 studied growing conditions. Traits were clustered in groups based on the proportion of explained variance by environmental factors (horizontal panels). Cluster identified corresponded to traits mainly impacted by site and sowing date (first panel), nitrogen fertilization (second panel), CO2 (third panel) and traits having a high residual component (fourth panel).

