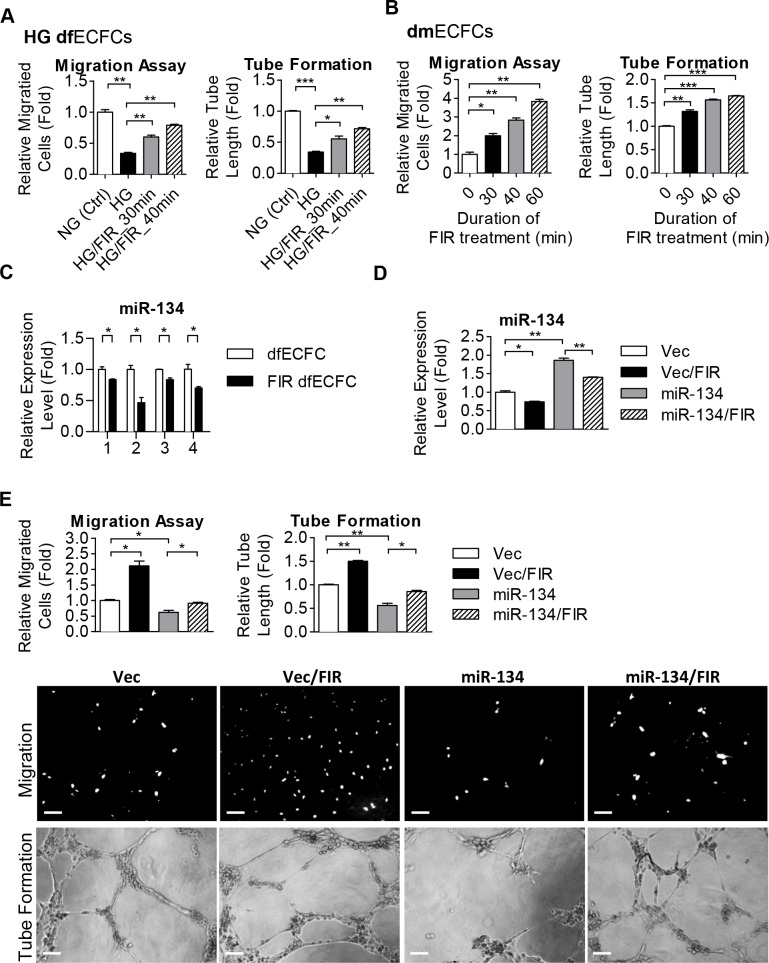
Fig 4. FIR treatment improves angiogenic activities of ECFCs.
(A) Quantitative data from the Transwell cell migration assays (left) and tube formation assays (right) using HG-dfECFCs with or without FIR treatment. n = 3 independent experiments. * p < 0.05, ** p < 0.01, *** p < 0.001 by one-way ANOVA followed by Tukey’s post-hoc test. (B) Quantitative data from the Transwell cell migration assays (left) and tube assays (right) using dmECFCs treated with FIR. n = 3 independent experiments. * p < 0.05, ** p < 0.01, *** p < 0.001 by one-way ANOVA followed by Tukey’s post-hoc test. (C) The expression levels of miR-134 in dfECFCs from four individuals with or without FIR treatment. * p < 0.05 by one-way ANOVA followed by Tukey’s post-hoc test. (D) miR-134 expression in vector control and miR-134 overexpressed dfECFC with or without FIR treatment. * p < 0.05, ** p < 0.01, by one-way ANOVA followed by Tukey’s post-hoc test. (E) Representative images (lower) and quantitative data (upper) from the Transwell cell migration assays and microvascular formation assays using vector control or miR-134 overexpressed dfECFCs with or without FIR treatment. n = 3 independent experiments. * p < 0.05, ** p < 0.01 by one-way ANOVA followed Tukey’s post-hoc test. Scale bar: 50 μm.

