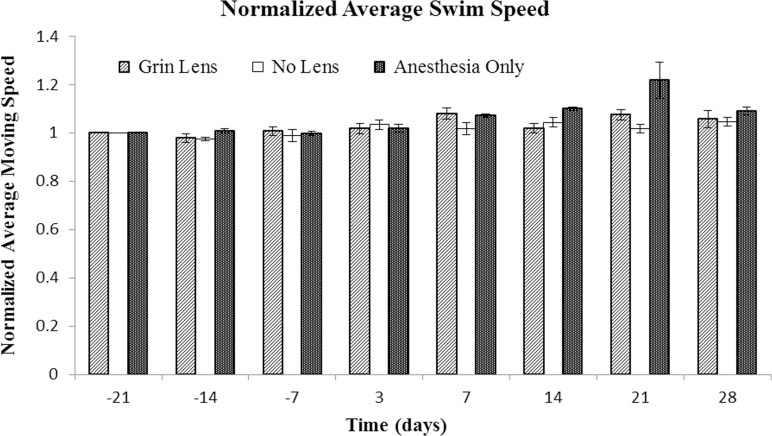
Fig 5. Comparison of swim speed in the Morris water maze test.
The performance of each mouse was normalized to its Day -21 performance. Bars are the standard error of the mean for each treatment group (n = 5 mice per treatment group). Tests were conducted -21, -14, and -7 prior to surgery and then 3, 7, 14, 21, and 28 days after surgery. There were no significant differences over time (p = 0.44) or between treatment groups (p = 0.51).

