
Fig 1. N–cycle emphasising the production of N2O through denitrification (grey arrows) and nitrification (red arrows).
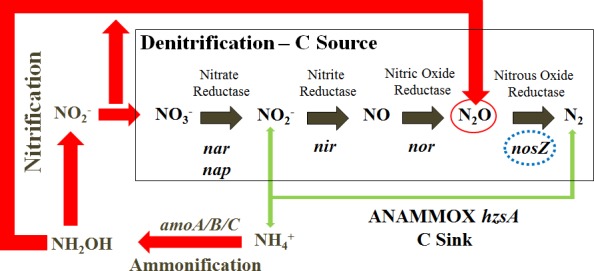
The production of N2 through anammox is presented with green arrows. Arrow width indicates suggested pathway importance in the south-eastern Indian Ocean. Marker genes for the different steps of the nitrogen cycle are in italics. The nitrous oxide reductase gene (nosZ) is highlighted with a dashed blue circle. Heterotrophic denitrification (nir/nor genes) is highlighted as a C source while the autotrophic anammox process (hzsA genes) is highlighted as a C sink. Note: dissimilatory reduction of NO2− to NH4+ and N2O is not presented on this figure. Figure adapted from Throbäck et al. [53]