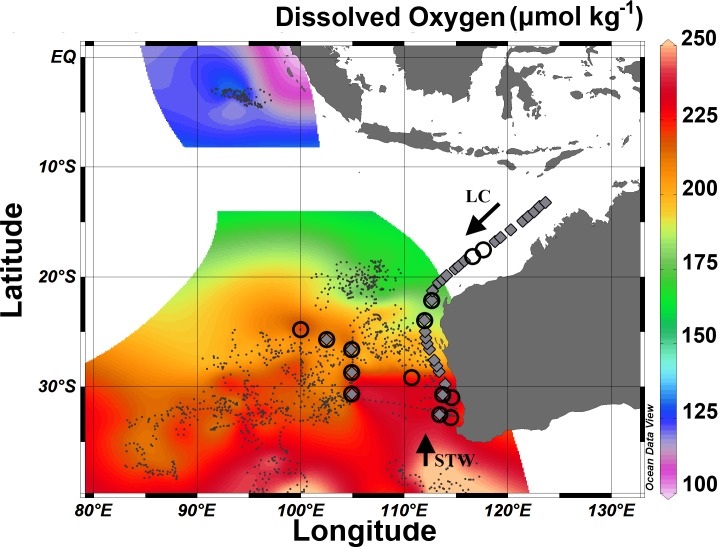
Fig 2. Spatial extent of oxygen concentrations (integrated from the surface to 200m depth).
Data (black squares) sourced from all available Argo floats with oxygen sensor in the region and cruise voyages conducted on the RV Southern Surveyor in 2010, 2011, 2012 and 2013. Low dissolved oxygen (<125 μmol.kg-1) stretches from the tropics to the subtropics. Black circles highlight sampling stations for functional N genes (nosZ and hzsA). Grey diamonds denote sampling station for heterotrophic microbial counts. Regional water masses Subtropical waters (STW) and Leeuwin Current waters (LC) are denoted by black arrows.

