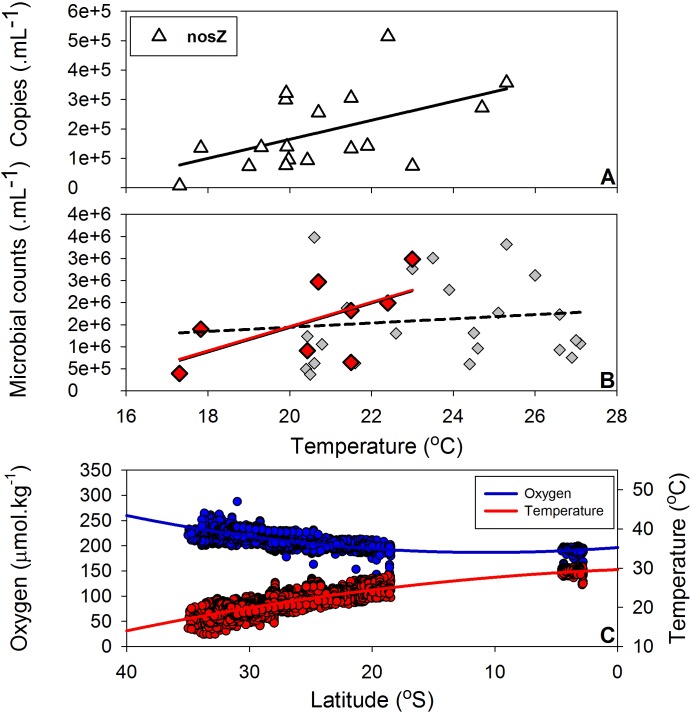
Fig 3. (A) Nitrous oxide reductase (nosZ) gene copies (copies mL-1) plotted against in situ temperature data (°C); nosZ: r2 = 0.27, slope = 32381 copies.°C-1, coefficient standard error = 13259, p = 0.027. (B) Microbial counts (cells mL-1) versus in situ temperature data; red diamonds denote stations where nosZ genes were measured.
These microbial counts suggest a positive correlation with temperature (r2 = 0.39, p = 0.098). Grey diamonds present regional microbial abundance but do not suggest a temperature correlation (r2 = 0.016, p = 0.5); see Fig 2 for spatial coverage. Fig 3 C presents a latitudinal relationship of oxygen (r2 = 0.6, p<0.0001) and temperature (r2 = 0.8, p<0.0001). Data are capped from the surface to 50 m depth and sourced from all available Argo floats through the Australian Argo DAC as part of the IMOS portal and cruise voyages conducted on the Southern Surveyor in 2010, 2011, 2012 and 2013.

