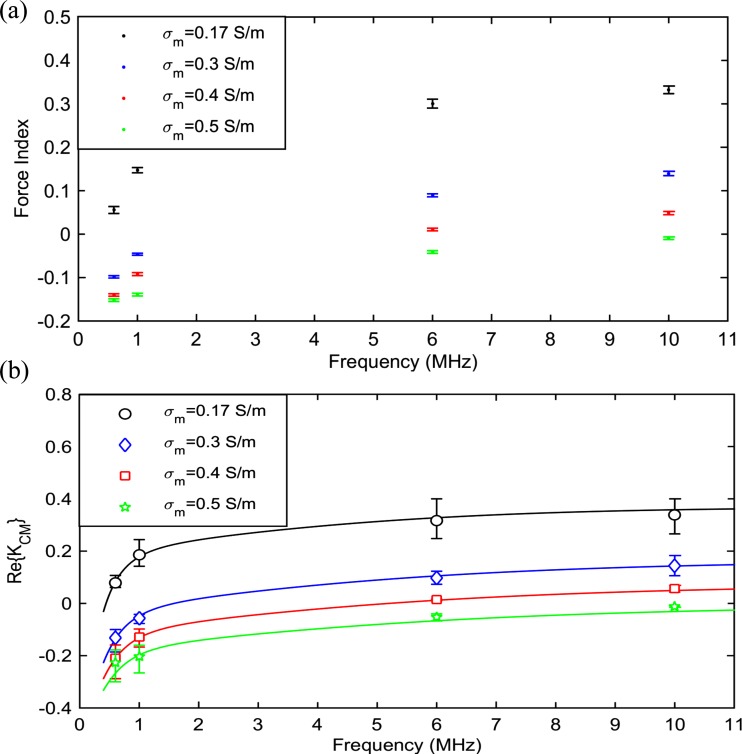
FIG. 8.
(a) Average measured force indices for CHO cells suspended in media with various conductivities. Each data point is the average of approximately 400 individual cells. Error bars represent the standard error of the mean. (b) corresponding to the measured force indices as obtained from simulations. Error bars represent the deviation in simulation results when the particle velocity is set to one standard deviation above and below the average velocity of measured cells. Data points correspond to the measured values in Fig. 8(a). Solid lines show the calculated spectrum using the curve-fitted CHO double-shell model dielectric parameters as determined later (see Table II).

