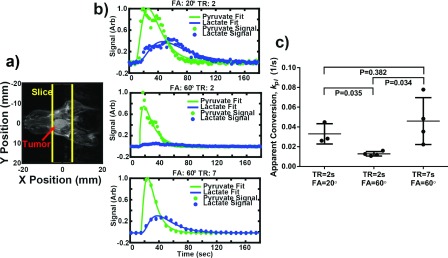
FIG. 8.
Comparison of kinetic data analysis from data acquired using different acquisition parameter combinations. (a) Anatomical image of a mouse bearing an anaplastic thyroid tumor and the slice used for dynamic HP spectroscopy. (b) Dynamic metabolite curves of the same animal scanned with excitation TR = 2 s and θ = 20° (top), TR = 2 s and θ = 60° (middle), and TR = 7 s and θ = 60° (bottom). (c) kpl values from animals scanned with TR = 2 s and θ = 20° (n = 3), TR = 2 s and θ = 60° (n = 4), and TR = 7 s and θ = 60° (n = 4). Data acquired with TR = 2 s and θ = 60° significantly underestimates kpl compared to the other two groups (P < 0.035).

