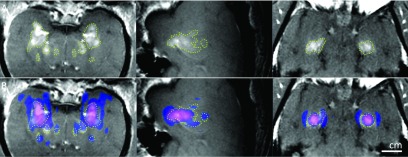
FIG. 6.
Simulation results (elastic wave model) superimposed on contrast-enhanced T1-weighted contrast-enhanced images acquired shortly after sonication (left: coronal view; middle: sagittal view for the left hemisphere target; right: axial view in the focal plane) for Monkey 2. (A) Hyperintense regions show the disruption of the BBB. The extent of the disruption was manually segmented (dotted lines). BBB disruption was not observed in white matter (*). (B) The simulated pressure field was thresholded at −14 dB for the left hemisphere target, −14.6 dB for the right hemisphere target, and superimposed on the MRI as a colored region. The extent of the BBB disruption was consistent with the simulated side lobes in the prefocal region, but not in the postfocal region.

