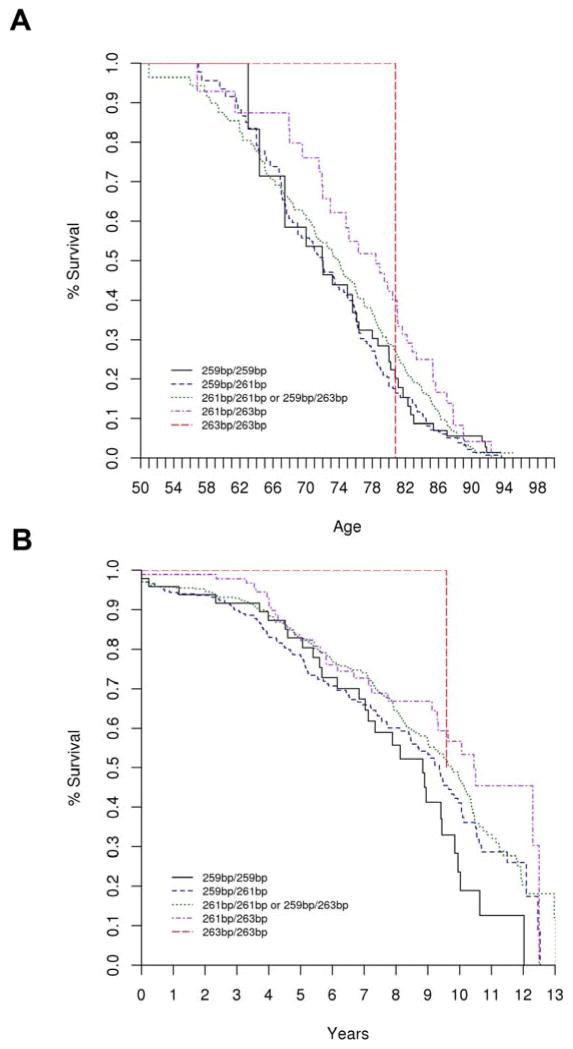
Figure 2.
Kaplan Meier plot for SNCA REP1 and survival free of cognitive impairment (TICS-M score ≤27 or AD-8 score ≥2). The genotype 259bp/259bp corresponds to REP1 score = 0, and 259bp/261bp to REP1 score = 1, and 261bp/261bp or 259bp/263bp to REP1 score = 2, and 261bp/263bp to REP1 score = 3, and 263bp/263bp to REP1 score = 4. Figure 2a corresponds to the covariate unadjusted, age-scale analysis (HR = 0.88, 95% CI 0.78–1.00, p = 0.058); and Figure 2b corresponds to the covariate unadjusted, time-on-study analysis (HR = 0.81, 95% CI 0.71–0.92, p = 0.0017).

