Figure 3.

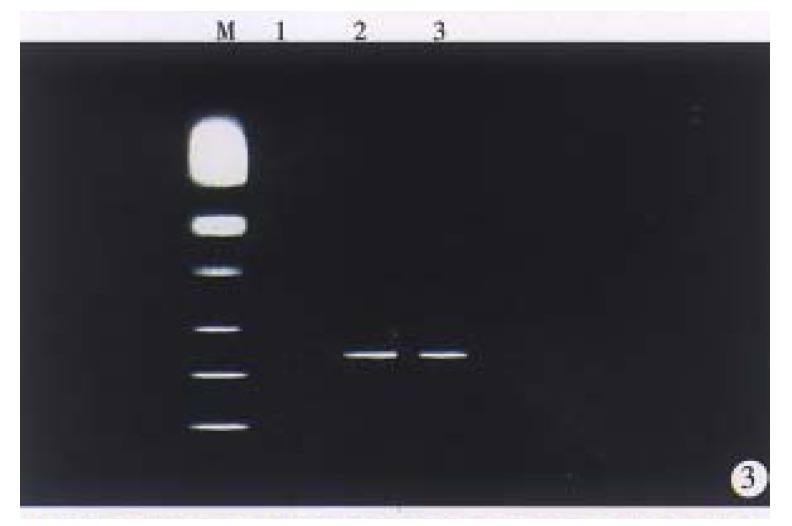
Electrophoresis analysis of RT-PCR products. Lane 1, normal mouse liver tissue (negative control); lane 2 and 3 transgenic mice liver tissue showed positive bands (439 bp). M, PCR standard marker (SABC).

Electrophoresis analysis of RT-PCR products. Lane 1, normal mouse liver tissue (negative control); lane 2 and 3 transgenic mice liver tissue showed positive bands (439 bp). M, PCR standard marker (SABC).