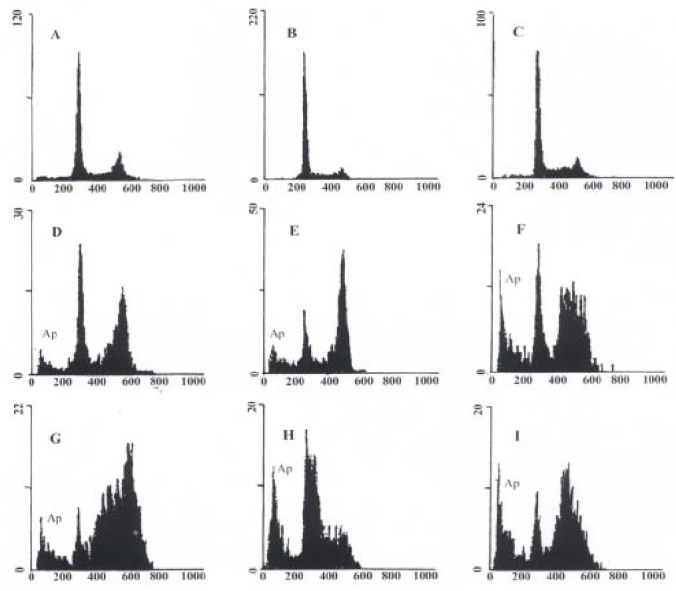
Figure 4.

Nuclear DNA contents measured by flow cytometry in As2O3 and HCPT-induced apoptosis in gastric cancer cells at 48 h. Ap represents apoptotic cells. A: Untreated MKN-45 cells; B: Untreated SGC-7901 cells; C: Untreate d MKN-28 cells; D: MKN-45 cells treated with 10 μmol/L As2O3; E: SGC-79 01 cells treated with 10 μmol/L As2O3; F: MKN-28 cells treated with 10 μmol/L As2O3; G: MKN-45 cells treated with 10 mg/L HCPT; H: SGC-7901 cells treated with 10 mg/L HCPT; I: MKN-28 cells treated with 10 mg/L HCPT.
