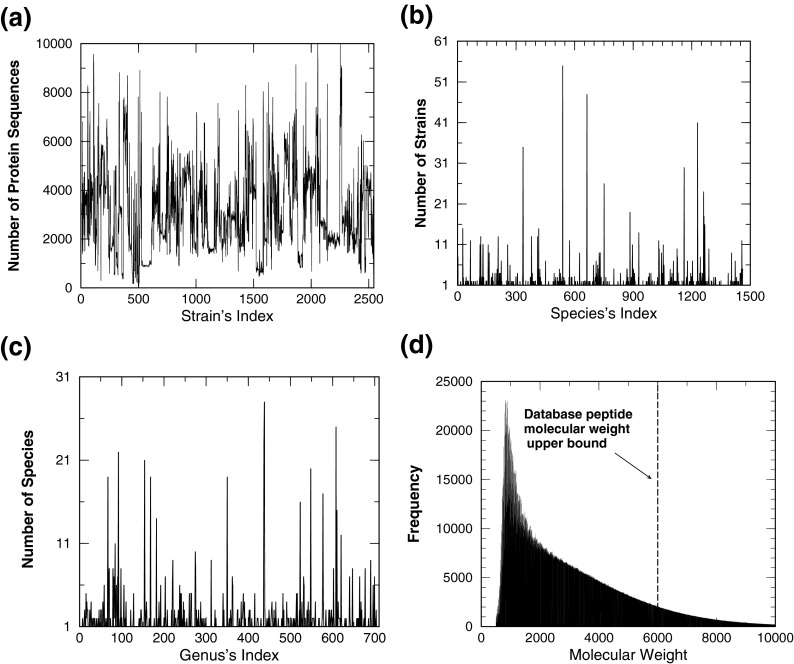
Figure 1.
Status of bacterial database used in this investigation. The curve in panel (a) shows the number of proteins used for each strain included in the database. Panel (b) ((c)) displays the number of strains (species) that belongs to a given species (genus). With 0.01 Da as the bin size, panel (d) displays the histogram for the number of peptides present in the database as a function of the molecular weight. The vertical dash-line (at 6000 Da) in panel (d) indicates the upper bound of molecular weight of peptides included in the current database

