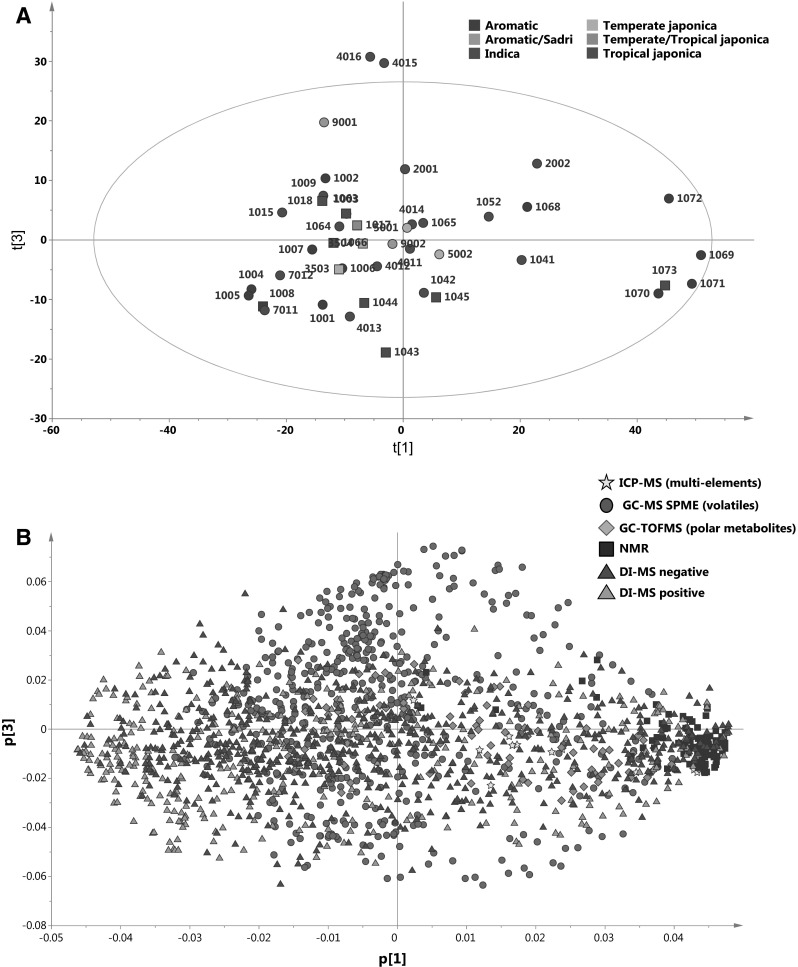
Fig. 1.

Principal component analysis (PCA) of the metabolome as detected by six different analytical platforms of 23 fragrant and 8 non-fragrant rice varieties. a Scores plot showing the first PC and third PC explaining 24.8 and 6.2 % of the variation respectively. Numbers next to the symbols represent the metaphor code of the rice varieties as given in Table S1. Different colors indicate the different germplasm classes. Circles indicate fragrant varieties while boxes represent non-fragrant varieties. b Loadings plot of the first PC versus the third PC. The five different analytical platforms are indicated by the different colored symbols (Color figure online)
