
Figure 5.
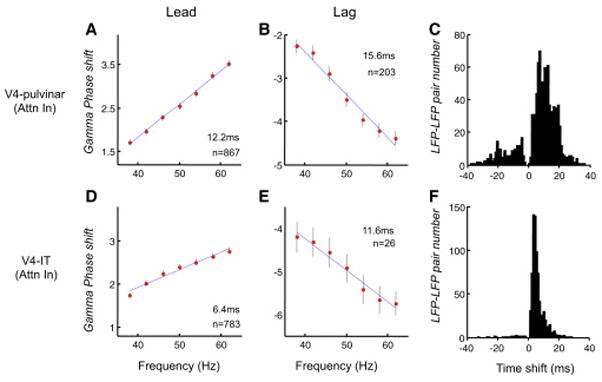
Directionality based on gamma frequency phase-shift across structures. (a) V4 led pulvinar in gamma phase. In 867 of 1608 V4 LFP pulvinar LFP pairs, the phase-lag of pulvinar to V4 increased linearly with the increasing frequency within the gamma range. The thick red dots represent the averaged phase-shifts across the 867 LFP pairs, and the SEM (±) of the averaged phase-shifts are marked by the vertical lines centered on these red dots. The regression line for these averaged phase-shifts is shown in blue, and the slope indicates that V4 led pulvinar by 12.2ms. (b) Pulvinar led V4 gamma phase. In 203 of 1608 V4 LFP – pulvinar LFP pairs, the phase-lag of pulvinar to V4 decreased linearly with the increasing frequency, and the slope indicated that pulvinar led V4 by 15.6ms. (c) Distribution of time shifts between V4 and pulvinar gamma oscillations. The positive time means that V4 gamma led pulvinar gamma. (d)-(e) show the phase-shift and the corresponding time-shift between V4 and IT gamma oscillations (totally 1072 pairs). The formats in (d),(e) and (f) are the same as the formats in (a), (b) and (c), respectively.