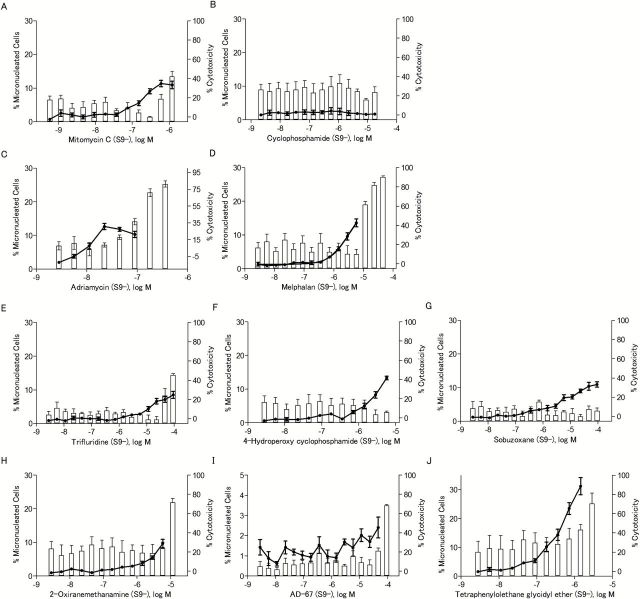
Figure 6.
The frequency of micronucleated cells after chemical treatment in the absence of S9. The line chart represents the percentage of binucleated cells with MN out of the total number of binucleated cells evaluated. The bar chart represents the NDI-based cytotoxicity. Data represents the mean ± SEM from three experiments.

