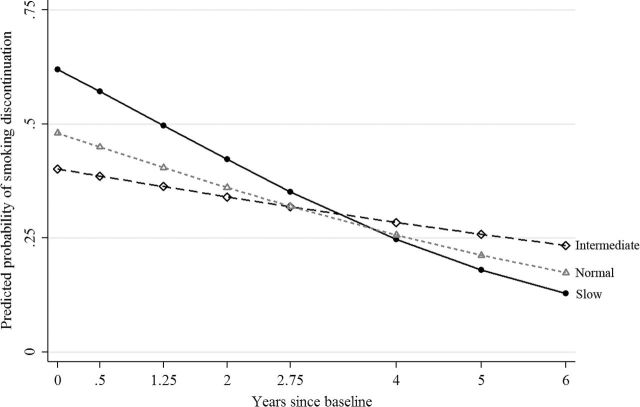
Figure 2.
Predicted probability of smoking discontinuation by CYP2A6 diplotype predicted rate (CDPR) and time calculated using estimates from the logistic portion of the zero-inflated Poisson growth-curve model predicting DAYS (Supplementary Table S-3, Logistic). Solid line with circle represents Slow CDPR, long-dashed line with diamond represents Intermediate CDPR and short-dashed line with triangle represents Normal CDPR. Predicted probability of smoking discontinuation was calculated with controls held at their mean value.

