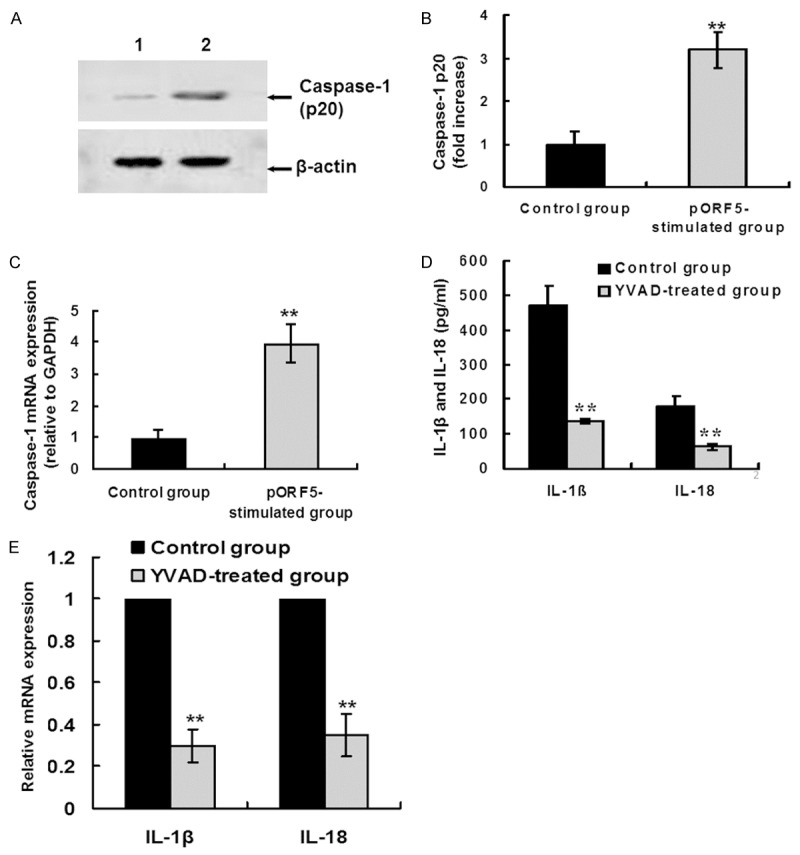
Figure 2.

pORF5 induces IL-1β and IL-18 production in a caspase-1-dependent manner. (A) THP-1 cells were stimulated with PBS (lane 1) and pORF5 (24 μg/ml, lane 2) for 24 hours. Cleaved caspase-1 p20 subunit was detected by western blot analysis. β-actin was used as an internal control. The representative results of three independent experiments were shown. (B) Quantitative comparison of caspase-1 p20 subunit expression by qRT-PCR. Data were derived from three independent experiments as in (A). The mean normalized optical density (OD) of caspase-1 p20 protein band relative to the OD of β-actin band from the same sample was calculated using the ImageTool 3.0 gray scale scanning software. The expression levels of caspase-1 p20 were expressed as fold changes compared with the control group. Data were expressed as mean ± SD. Student’s t test, **P < 0.01. (C) THP-1 cells were treated as the same in (A). Caspase-1 mRNA levels were measured by qRT-PCR. The expression levels of the target genes were normalized to the endogenous control GAPDH expression and expressed as fold changes compared with the control group. The data represents mean ± SD of three independent experiments. Student’s t test. **P < 0.01. (D) THP-1 cells were treated with pORF5 (24 μg/ml) only for 24 hours (control group) or pretreated with Z-YVAD-FMK (a specific caspase-1 inhibitor, 20 μM) for 30 min before pORF5 treatment (YVAD-treated group). Mature IL-1â and IL-18 protein expression was detected using ELISA. The data represents mean ± SD of three independent experiments. ANOVA, **P < 0.01 relative to the control group. (E) THP-1 cells were treated as the same in (D). IL-1â and IL-18 mRNA expression was detected using qRT-PCR. The expression levels were obtained as the same in (C). The data represents mean ± SD of three independent experiments. ANOVA, **P < 0.01 versus the control group.
