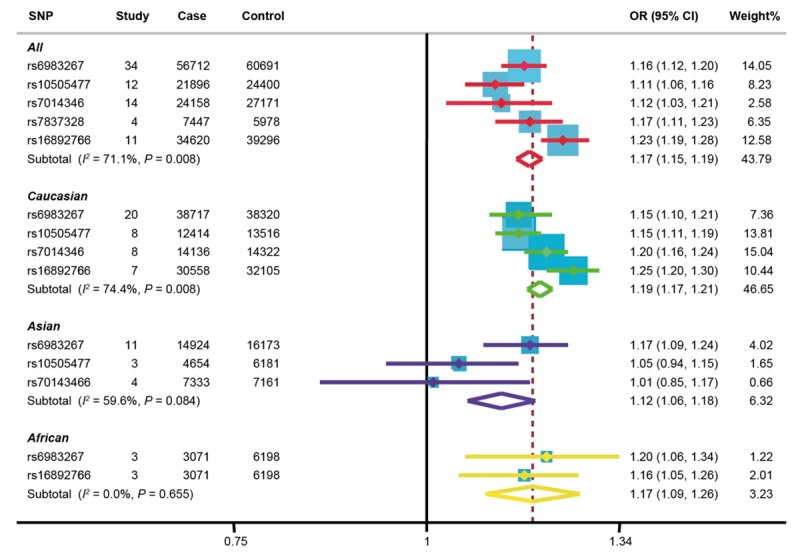
Figure 2.

Forest plot presenting the meta-analysis of the association between 5 polymorphisms (rs6983267, rs10505477, rs7014346, rs7837328 and rs16892766) in 8q23.3 or 8q24.21 region and risk of CRC as well as subgroup analysis of 4 polymorphisms (rs7837328 excluded) by ethnicity in allelic model.
