
Figure 1.
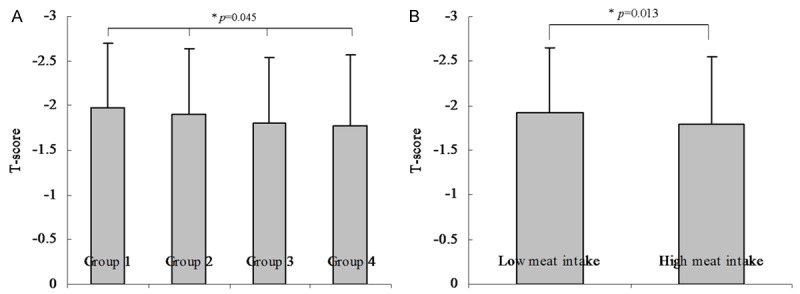
Comparison of T score among groups according to frequency of meat food intake. A: The results of comparison of T-score among groups according to Model 1 (Model 1: frequency of meat food intake were categorized by group 1: seldom, group 2: once or twice per week, group 3: once per 2 days, and group 4: always). The mean T-score was -1.96, -1.90, -1.81 and -1.78 in the four groups, respectively. There were significantly differences among the four groups (P value = 0.003). B: The results of comparison of T-score between groups according to Model 2 (Model 2: frequency of meat food intake was categorized by low frequency and high frequency groups). The mean T-score was -1.92 and -1.80 in the two groups, respectively. There were no significantly differences between the two groups (P value < 0.001).