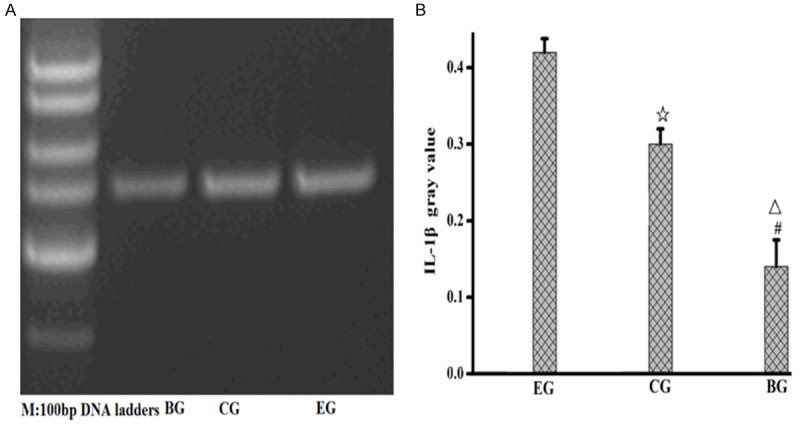
Figure 6.

Expression level of IL-1βmRNA in lung tissues of the rats in the three groups. A. Expression level of IL-1βmRNA in lung tissues; B. Gray value of IL-1βmRNA in lung tissues; EG, experiment group; CG, control group; BG, blank group; ☆, EG compared to CG, P=0.001; △, EG compared to BG, P=0.001; #, CG compared with BG, P<0.05.
