
Fig. 2.
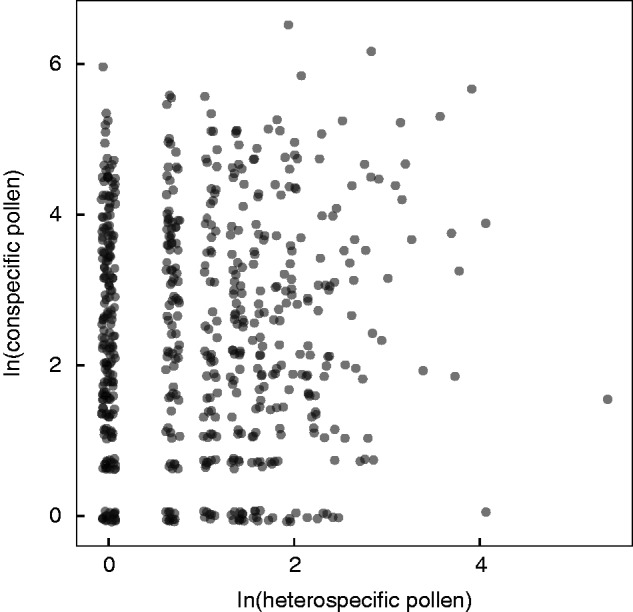
Relationship between heterospecific pollen and conspecific pollen. Counts of conspecific and heterospecific pollen are shown with natural log transformation to better visually depict the relationship, and are jittered to improve visualization of overlapping data points. The two variables are uncorrelated (raw data, non-parametric Spearman’s ρ = 0·007, P = 0·86).