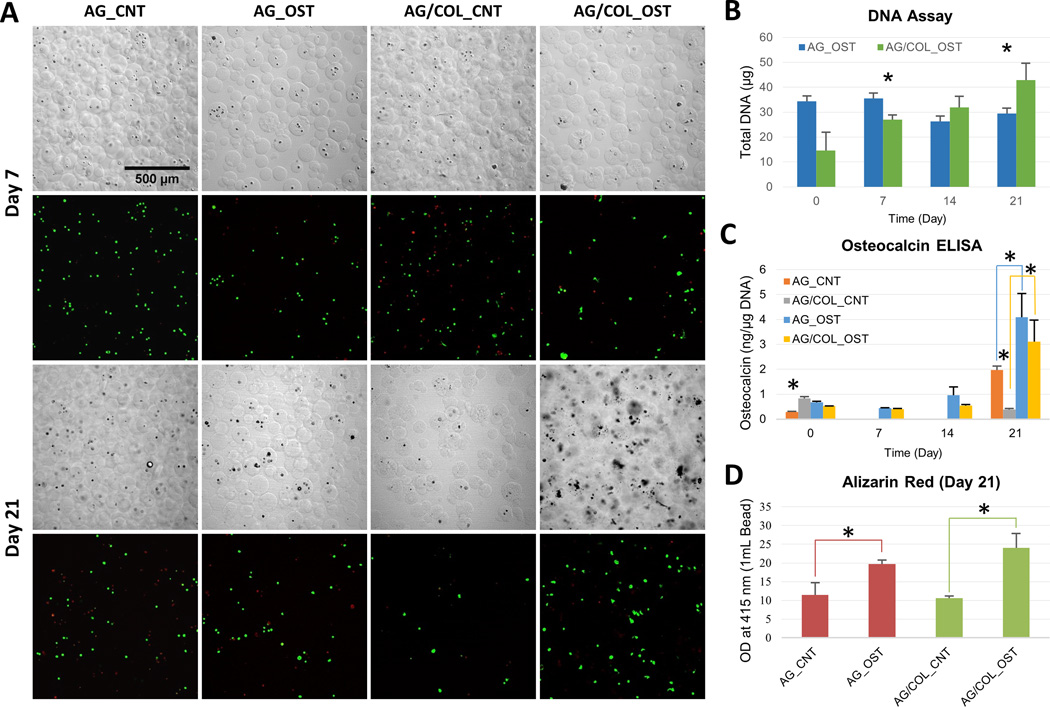
Figure 4.
Osteogenic differentiation of MSC in microbeads. (A) DIC images of microbeads with corresponding Live/Dead® confocal fluorescence images at day 7 (top two rows) and day 21 (bottom two rows). (B) DNA content of AG and AG/COL-II microbeads over time in culture. (C) Osteocalin production by hMSC in AG and AG/COL-II microbeads over time in culture. (D) Calcium phosphate mineral deposition by hMSC in AG and AG/COL-II microbeads over time in culture. All images at same magnification. (*) indicates p<0.05. Best viewed in color.

