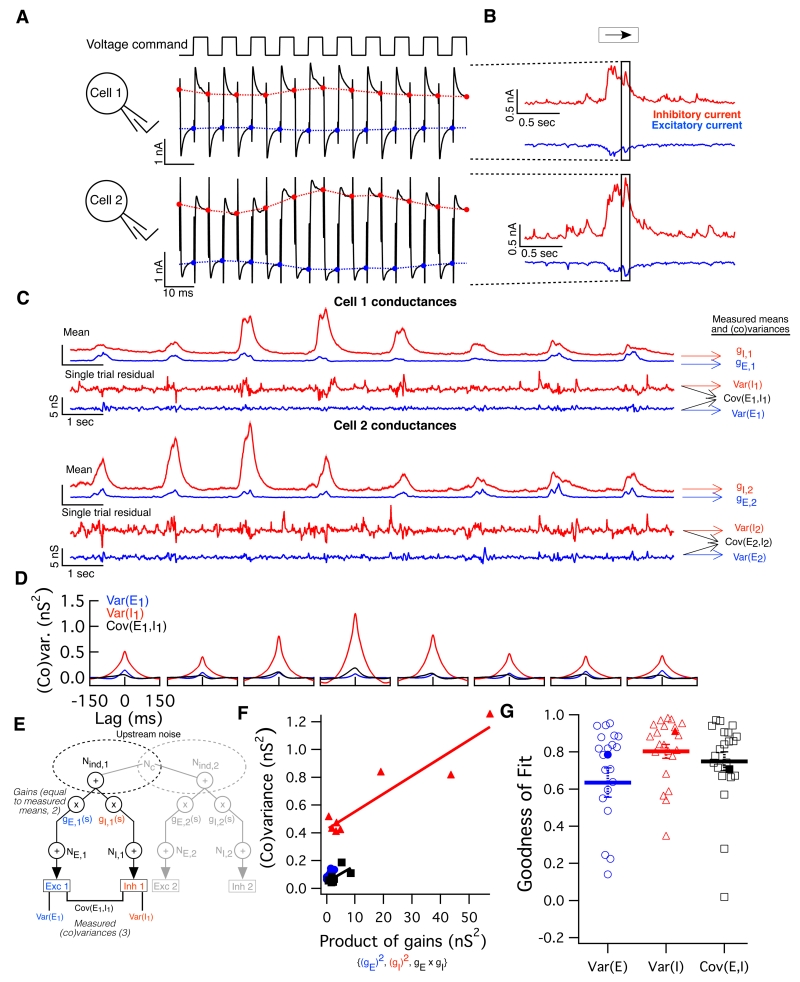
Fig. 3. Alternating voltage clamp measurements reveal sources of variability in single-cell synaptic inputs.
(A) Method of paired alternating voltage clamp recordings: The voltage command (top) for both cells recorded simultaneously was alternated between the excitatory and inhibitory reversal potentials while the current (black traces) was recorded. Interpolating between the last value measured on each cycle yields an estimate of each cell’s excitatory (blue) and inhibitory (red) current nearly simultaneously. (B) We simultaneously measured these four synaptic currents (excitatory and inhibitory inputs to each cell) while presenting moving bar stimuli. Highlighted region corresponds to the traces in (A). (C) Excitatory (blue) and inhibitory (red) conductances in a pair of ooDS cells measured simultaneously in response to moving bars. Mean responses (shading indicates S.E.M.) reveal tuning of input conductances. Subtracting the mean conductance traces (over nearby trials) from single-trial traces, we obtained residuals, which are shown for a single trial. (D) Using conductance residuals, we computed three single-cell (co)variances of the inputs (as a function of time delay) for each stimulus and each cell in the pair: inhibitory variance (red), excitatory variance (blue) and single-cell excitatory-inhibitory covariance (black). Shown are the (co)variance functions for cell 1 of the example pair. (E) Schematic of stimulus-dependent gain model. A portion of upstream noise is shared between cells and among excitatory and inhibitory channels. Upstream noise is multiplied by a stimulus-dependent gain factor: gE,1(s) or gI,1(s), defined as the measured mean conductance in each channel for each stimulus. Thereafter, independent, post-gain, noise is added to each channel (NE,1 and NI,1, respectively), yielding the noisy conductance inputs to the cell. Measured simultaneously, these inputs reveal the three possible (co)variances into a single cell. (F) Single cell peak (co)variance as a function of gain product for the responses of cell 1 above to 8 different stimuli. Solid line shows the linear best fit: data confirm the model’s prediction that (co)variance should be linearly related to the relevant gain product. (G) Linear correlation coefficients between (co)variance and gain product for the three single-cell input (co)variances measured in 21 ooDS cells. Thick lines and error bars indicate mean +/− S.E.M. and filled points indicate the example cell.

