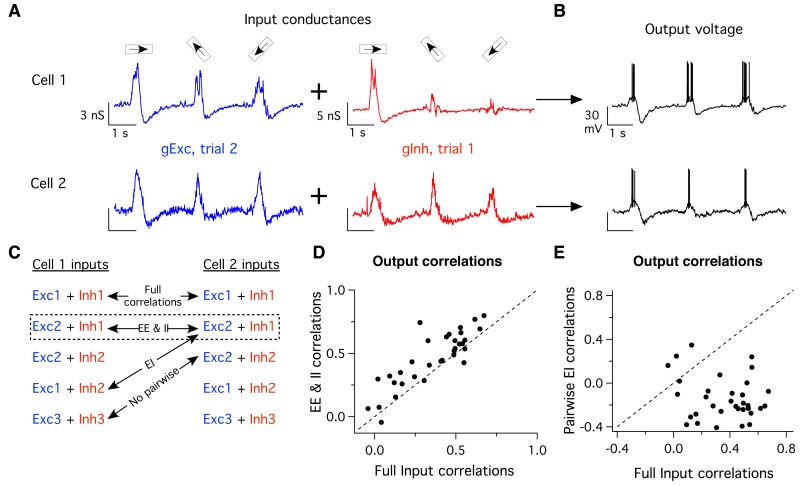
Fig. 5. Pairwise input correlations differentially shape output correlations.
(A) Example input conductance traces measured in alternating-voltage experiments using three different bar directions, and injected into recipient cells in dynamic-clamp experiments. By shuffling conductance combinations we can exclude or include specific sets of input correlations. For these inputs to cell 1 (top) and cell 2 (bottom) on this trial, we have taken the excitatory conductances measured on trial 2 and combined them with the inhibitory conductances measured on trial 1, leaving only pairwise EE & II input correlations intact, while breaking all other sources of input correlations. (B) Combined conductances are injected into a recipient ooDS cell, whose output voltage is measured, and spike correlations are measured as in Figure 1. (C) Schematic showing the logic of shuffling input conductances to include specific sets of pairwise input correlations. (D) Correlation coefficients for dynamic clamp trials where all input correlations were left intact versus those where only pairwise EE & II correlations remained. Each point corresponds to one stimulus for one pair, shown are data from 11 cells, three stimuli each (52-88 trials, mean 72 trials). Dotted line is unity. Removing pairwise EI correlations increased output correlations (p = 2×10⁻⁵, paired t-test) (E) Same as (D) but showing trials where all input correlations remained versus those wherein only pairwise EI correlations were intact. Removal of pair-wise EE & II correlations decreased output correlations (t-test, p = 2×10⁻¹⁰, paired t-test).

