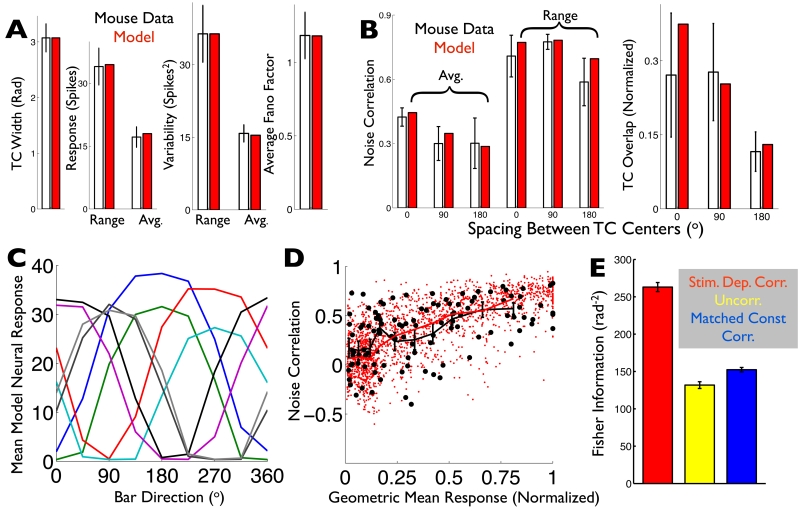
Fig. 6. A computational model captures the ooDS cell population response statistics and reveals that stimulus-dependent correlations significantly improve the population’s direction code.
(AB) Spiking statistics (black: ooDS cell population mean +/− S.E.M.) to which the the model (red: average over 25 8-cell model populations) was fit. (A) Single-cell statistics. (B) Pairwise statistics (see Supporting Information). (C) Tuning curves of an example 8-cell population generated by the fitted model. (D) The rate-correlation relationship (Fig. 1F) was not used in training the model; it serves as an independent test. Correlation coefficient and geometric mean response for 250 model cell pairs (red dots) and 14 experimentally observed ooDS cell pairs (black circles), each in response to 8 different stimuli. The two distributions are not significantly different (2-dimensional KS test, KS statistic 0.15, p=0.2). Overlain are the mean correlation coefficients in the experimental data (black symbols: mean +/− S.E.M.) in different bins of geometric mean response and in the computational model (solid red curve). (E) Fisher information provided by model 8-cell population responses about the stimulus direction. Colors indicate the assumed correlation structure: stimulus-dependent correlations, as in the experimental data (red); no correlations (yellow); or “matched” stimulus-independent correlations that, for each cell pair, match the stimulus-average of their stimulus-dependent correlation coefficients (blue). Error bars in (E) are the S.E.M. over ensembles of 10 randomly-generated model populations.

