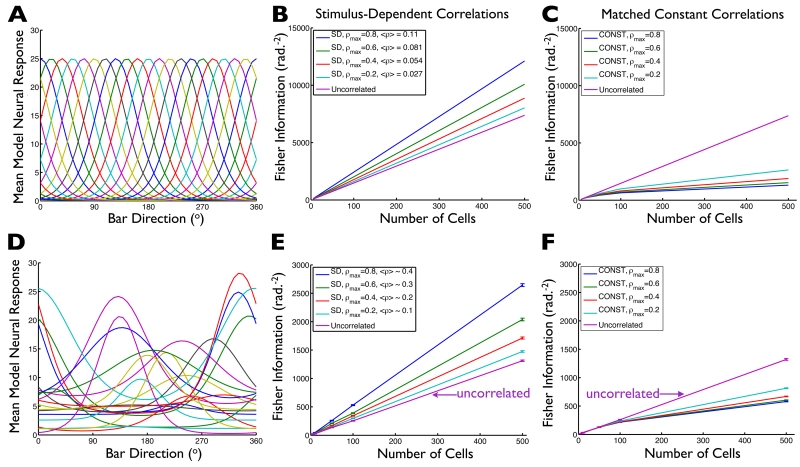
Fig. 7. Stimulus-dependent correlations typically improve population coding.
We generated model neural populations of different sizes, with either identically-shaped and evenly displaced tuning curves (example population shown in panel (A)), or with randomly shaped and located tuning curves (example population shown in panel (D)). For each population, we assumed Poisson-like variability, and let the noise correlations coefficients be stimulus-dependent (being proportional to the geometric means of the cells’ tuning curves), with the overall magnitude of correlations in the population being determined by the parameter ρmax (maximum possible correlation coefficient, obtained for cell pairs where both cells are firing at their maximum possible rates). For populations of different sizes, and with different ρmax values, we then computed the Fisher information those populations provide about the stimulus. On balance, stronger stimulus-dependent correlations yield better coding performance, over a wide rage of population sizes (BE). (CF) To understand how the stimulus-dependence of the noise correlations affects the population code, we repeated our calculations from panels (BE), but instead of keeping the “full” stimulus-dependent correlation structure, we replaced the correlation coefficients for each cell pair with the average over stimuli of that pair’s stimulus-dependent correlations: average correlations are “matched” between (B) and (C), and between (E) and (F). With stimulus-independent correlations (in stark contrast to stimulus-dependent ones), larger correlations correspond to weaker population codes (CF). Error bars in (EF) are the S.E.M. over ensembles of 20 randomly-chosen model populations. Average correlations values in the legends of (BE) are averages over all stimuli and all cell pairs. The values are larger for the heterogeneous population because the heterogeneous population has, on average, wider tuning curves.

