
Figure 7.
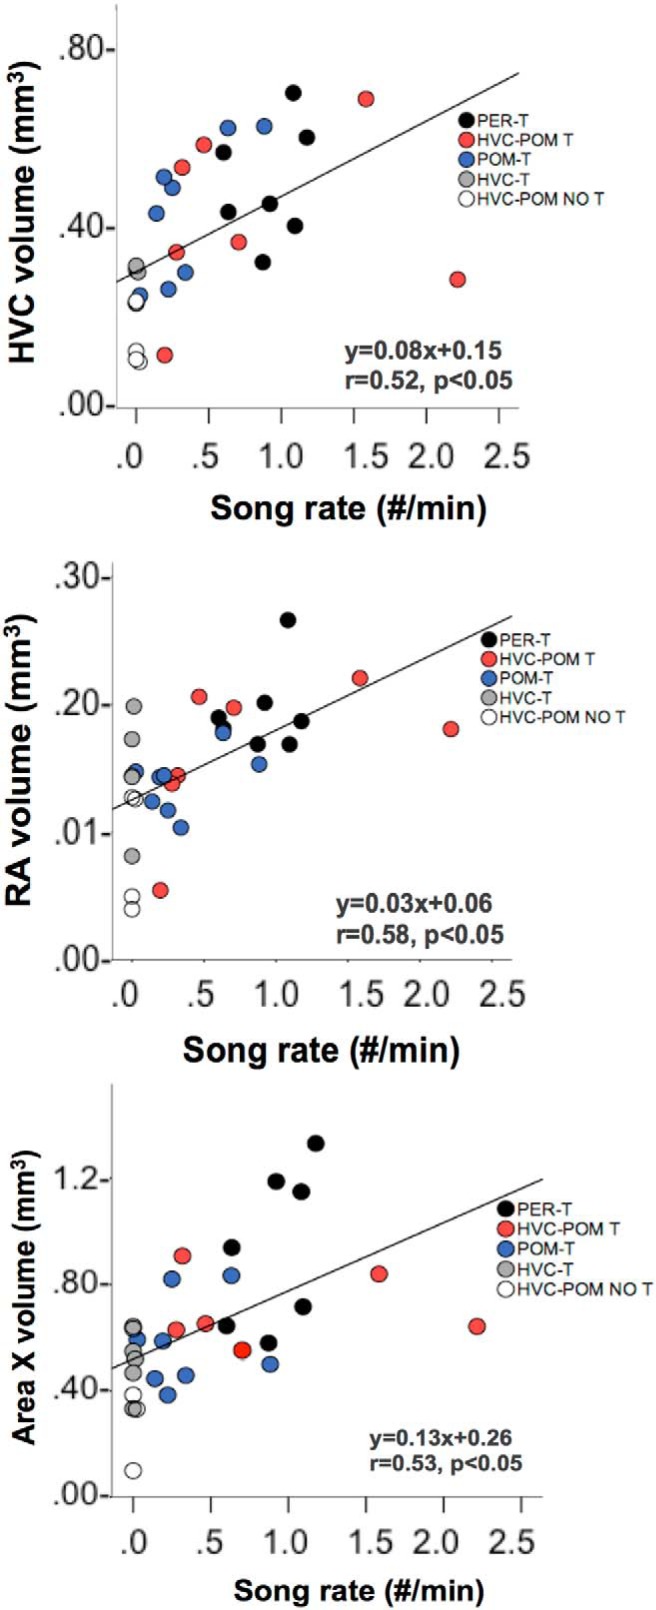
Relationship between song rate (number/minute), and the total volumes of HVC, RA, and Area X. Individual data points from the different experimental groups are coded by different colors. The equation for the regression line, the Pearson’s correlation coefficient r, and the associated p value are shown in the bottom right portion of each correlation graph. PER-T, n = 7; HVC-POM T, n = 7; POM-T, n = 8; HVC-T, n = 5; HVC-POM NO T, n = 4.