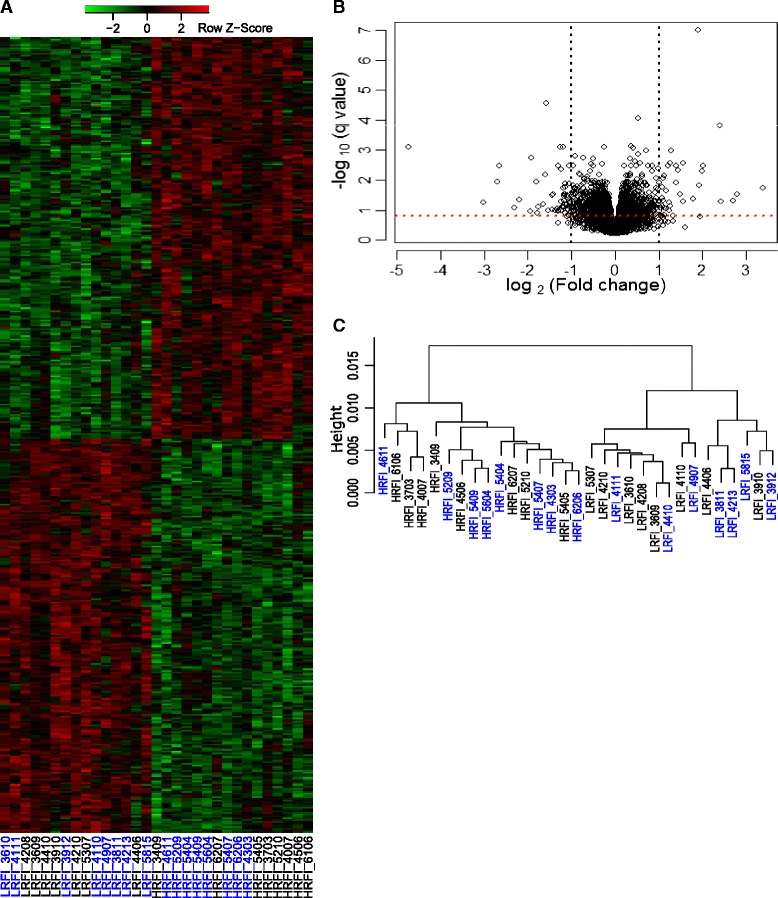
Fig. 2.

Differentially expressed genes and transcriptomic differences between the low and high RFI groups. a Heatmap showing 454 DEGs (q ≤ 0.05) between low and high RFI groups identified by RNA-seq. Sample names are designated as RFI line followed by the pig identifier. LRFI, low RFI line; HRFI, high RFI line. Animals with sample names in blue were fed the high-fiber, low-energy diet (LFD), while animals with sample names in black were fed the low-fiber, high-energy diet (HFD). The relative orders of genes and samples were determined by two-way hierarchical clustering based on the adjusted transformed gene expression of the 454 DEGs. The adjusted gene expression was gene-wise standardized to get the z-score as displayed. b Volcano plot showing the magnitude and significance of differential expression of genes between low and high RFI groups. Black vertical dash lines correspond to │log2(fold change)│ = 1, while red horizontal dash line correspond to q-value of 0.15. FC, fold change calculated as the ratio of mean gene expression in the low RFI group to mean gene expression in the high RFI group after accounting for the other relevant variables. c Hierarchical clustering showing relationship of the 31 RNA-seq samples. The samples were hierarchically clustered by using Ward method with 1 minus Spearman correlation as distance. The Spearman correlations between pairs of samples were calculated based on the adjusted transformed expression of the 12280 genes
