
Fig. 3.
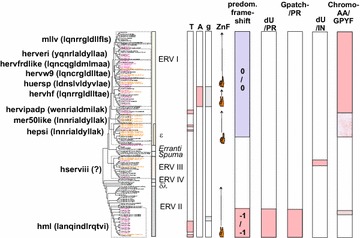
Mapping of taxonomic markers on an unrooted consensus maximum likelihood cladogram of the HERV groups and supergroups. At the left, HERV supergroups are shown with the first 13 amino acids of a representative ISD within parenthesis. HSERVIII have no known envelope proteins of their own, symbolized with a question mark. The occurrence of nucleotide bias (High T or A, or low g), predominant number of zinc fingers in Gag, predominant gag;pro and pro;pol frame shift strategy, occurrence of dUTPase and GPATCH domains together with the protease and occurrence of dUTPase and Chromo and/or GPY/F domains in the C terminus of the integrase, are shown. Colour codes for branch names: consensus sequences (con) are magenta, best representatives (bre) are in brown. The Chromo and/or GPY/F reddish fill was weaker for some groups because of inconsistent (HEPSI) or weak fit (HML6)