
Fig. 2.
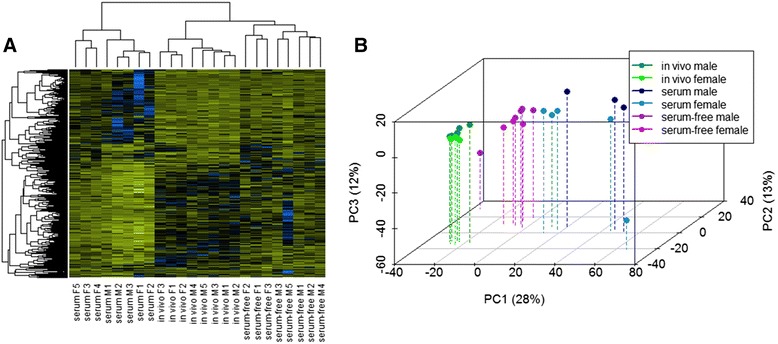
Hierarchical clustering and PCA of differentially expressed genes among the different blastocysts. a Heatmap including all the differentially expressed genes. The color spectrum, ranging from yellow through black to blue, represents TMM normalized expression values scaled between −4.5 and 4.5, indicating low to high expression. Two main clusters were formed, with embryos cultured in the presence of serum in one cluster and in vivo derived and serum-free embryos in the other. b PCA of the 24 embryos used in the study considering all the differentially expressed genes. Each dot represents one blastocyst