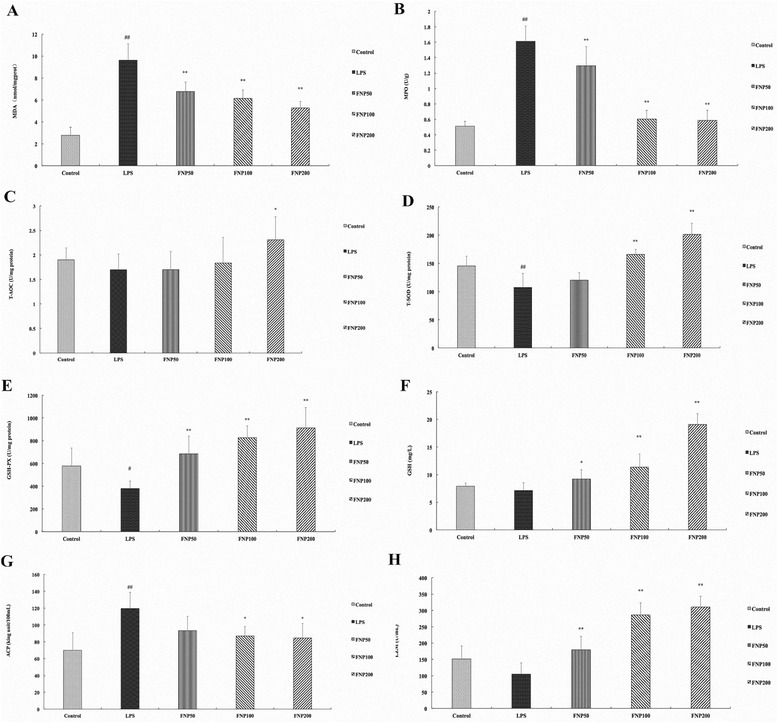
Fig. 4.

Effects of FNP on antioxidant capacity in LPS-stimulated mice. Notes: The mice in the LPS group were injected intraperitoneally with 17 mg/kg (body weight) of LPS, while control group were injected with PBS (10 mL/kg). FNP50, FNP100 and FNP200 group were orally administrated with diverse dose FNP (50 mg/kg, 100 mg/kg and 200 mg/kg) for 3 days before instillation of LPS. Serum, homogenates of small intestine and liver were prepared. (a) MDA level in small intestine. (b) MPO level in small intestine. (c) T-AOC level in liver. (d) T-SOD level in liver. (e) GSH-PX level in liver. (f) GSH level in serum. (g) ACP level in serum. (h) LZM level in serum. Each column represented as the means ± SD from three independent experiments (n = 10). ## P <0.01 vs control group; * P <0.05 vs LPS group; ** P <0.01 vs LPS group
