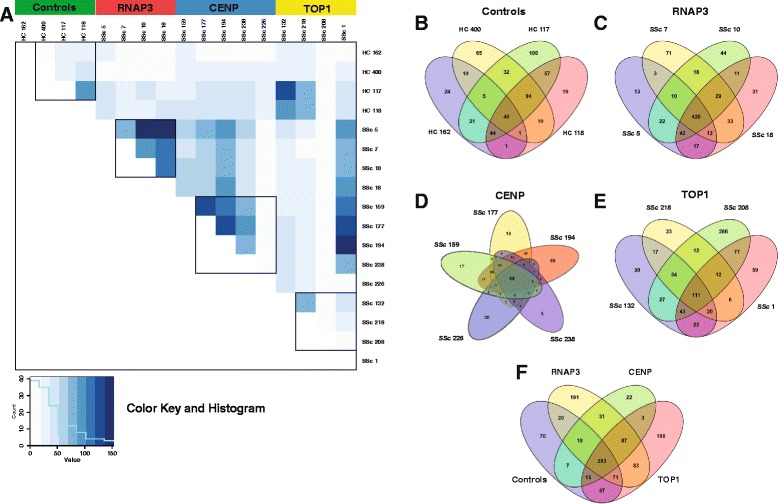
Fig. 1.

Overview of mass spectrometry results. a Correlation matrix of non-redundant protein hits for all patients and controls. Comparisons were performed using Fisher’s exact test with the Bonferroni correction. Black boxes indicate intra-group comparisons for each of the four clinically defined groups. Green controls; red RNA polymerase III (RNAP3); blue centromere protein (CENP); yellow topoisomerase I (TOP1). b-f Venn diagrams depict overlap in non-redundant peptide hits within and between groups. b healthy controls, c RNAP3, d CENP, e TOP1, and f overlap between groups
