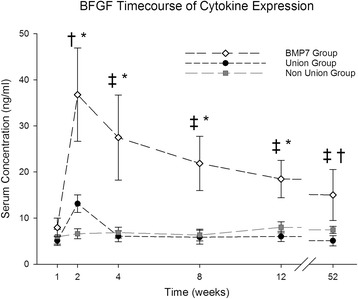
Fig. 3.

Analysis of serum BFGF expression level. BFGF serum level comparison over time for the entire study patients divided into groups (Union: Fracture patients with proper healing, Non-Union: Fracture patients developing non-unions, BMP-7: Non-union patients treated with BMP-7) expressed as means and SEM. Serum concentration was measured in nanogram per milliliter (ng/ml). The Wilcoxon signed rank test assessed significant differences between both groups at each particular time point († indicates significant differences between the Non-Union and Union Group, * indicates significant differences between the Non-Union and BMP-7 Group, whereas ‡ indicates significant differences between Union and BMP-7 Group p < 0.05)
