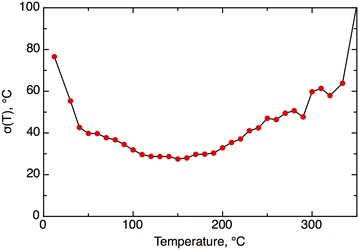
Fig. 5.

The experimental accuracy of the data as a function of the MP temperature. Each point averaged at least 50 measurements. The graph was built using N = 18,058 differences in the MP temperatures and was rescaled to match the average experimental accuracy of σ = 35 °C. Compounds with MP <0 °C, most of which were data processing errors, were excluded
