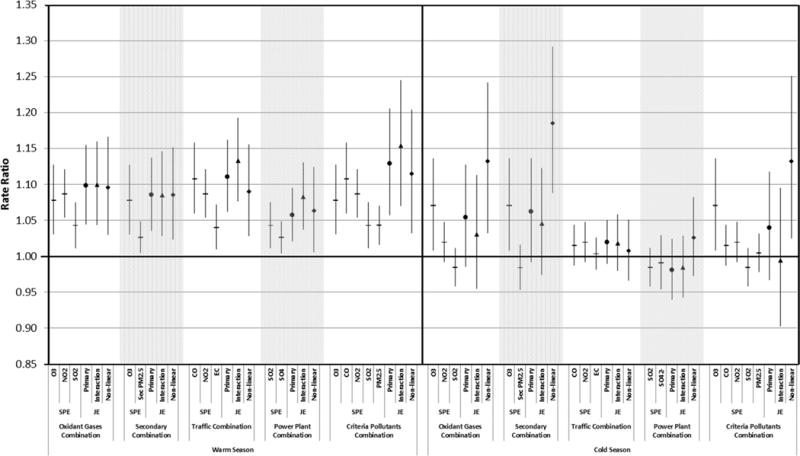
Figure 1. Rate ratios and 95% confidence intervals for single pollutant effects per interquartile-range increment in each pollutant from single pollutant models and for corresponding joint effects from multi-pollutant models.

For each combination of pollutants, single-pollutant rate ratios (shown with horizontal line markers) are followed by joint effect rate ratios from the primary multi-pollutant models, which had linear pollutant terms and no interactions (“Primary”, circle markers), multi-pollutant models with linear pollutant terms and first order interactions between pollutants, with IQR increments evaluated starting at the 25th percentile for each pollutant (“Interaction”, triangle markers), and multi-pollutant models with linear, quadratic and cubic pollutant terms and no interactions, with IQR increments evaluated starting at the 25th percentile for each pollutant (“Non-linear”, diamond markers). For comparability with previous analyses,22 the analysis used the year-round IQR during 1993–2004 for O3, NO2, CO and SO2, and during August 1, 1998-December 31, 2004 for PM2.5 and PM2.5 components. The IQRs used in the analysis were: O3 29.18 ppb, CO 0.66 ppm, NO2 12.87 ppb, SO2 10.51 ppb, PM2.5 9.18 μg/m3, EC 0.69 μg/m3, SO42− 3.45 μg/m3, Secondary PM2.5 4.52 μg/m3. PM2.5: particulate matter <2.5 μm in diameter, O3: ozone, NO2: nitrogen dioxide, SO2: sulfur dioxide, Sec PM: Secondary PM2.5, CO: carbon monoxide, EC: elemental carbon component of PM2.5, SO4: Sulfate component of PM2.5. Secondary PM2.5 was calculated as the sum of the concentrations of selected PM2.5 components including nitrate (NO3−), ammonium (NH4+), and sulfate (SO42−).
