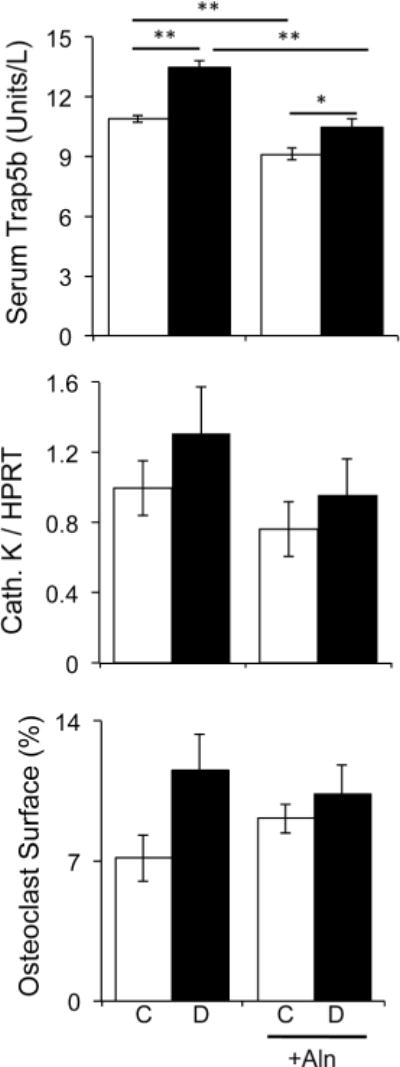
Figure 7. Alendronate effects on bone resorption markers.

Serum TRAP5 concentration, cathepsin K mRNA levels, and osteoclast surface were analyzed in non-treated and alendronate treated in control (white bars) and diabetic (black bars) mice at the 40 day time point. Bars represent the average value ± SE (n=7–8 per group). Data was analyzed by one-way ANOVA followed by Fisher post hoc tests to compare differences between groups, *p<0.05, **p<0.01.
