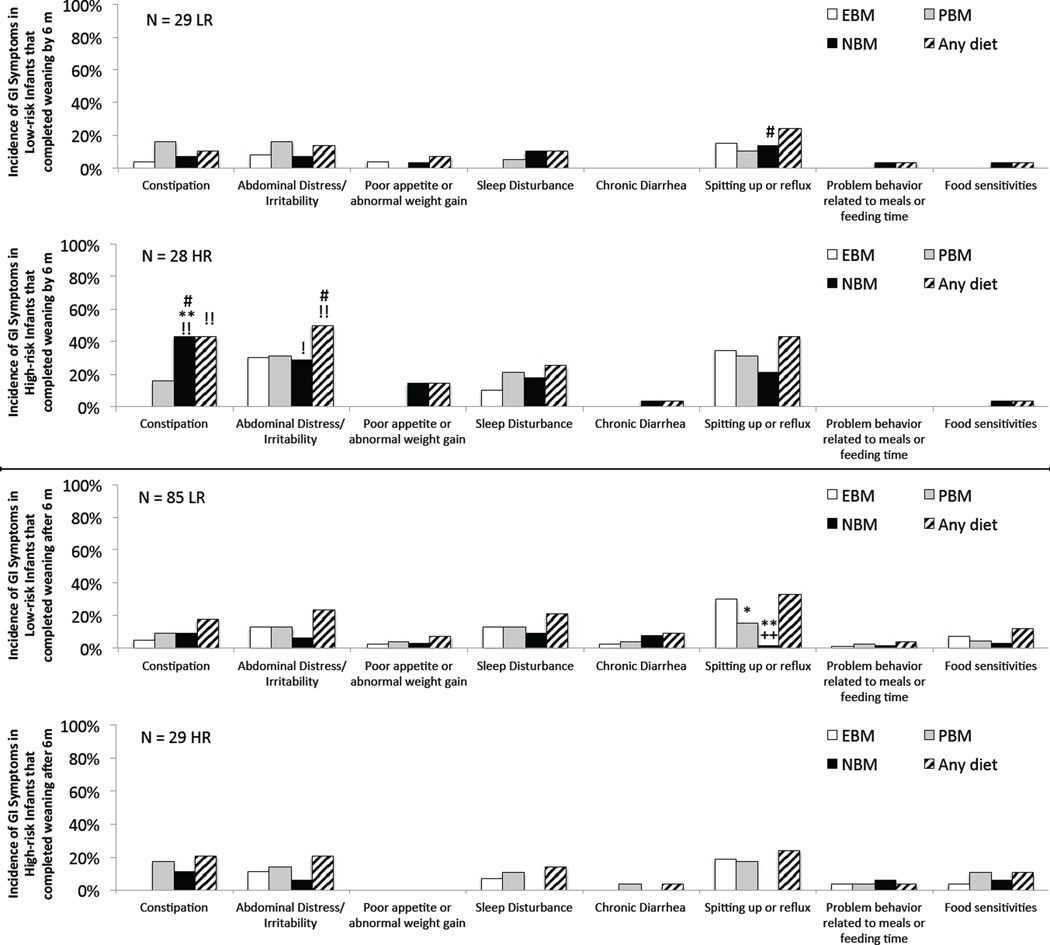
Figure 4.
Infants divided into those that completed weaning before versus after 6 months. Prevalence of GI symptoms within each diet category for the subset of (1st and 3rd rows) Low-risk and (2nd and 4th rows) High-risk infants that completed weaning (top two rows) prior to 6 months of age or (bottom two rows) after 6 months of age. ** p < 0.0006 NBM or PBM versus EBM, ++ p = 0.004 NBM versus PBM, !! p < 0.008 High-risk versus Low-risk group, ## p < α infants that completed weaning before versus after 6 months. Note, α = 0.013 (Fisher test, Bonferroni-correction factor of 4) for differences involving EBM, PBM, and NBM categories (each is compared against the other two diet categories and against the same diet category in the other risk group and the other weaning age subset); but α = 0.025 for the “Any diet” groups since they are only compared to the “Any diet” category of the other risk group and other weaning age subset. Single symbols indicate marginal significance (α < p < 0.05).

