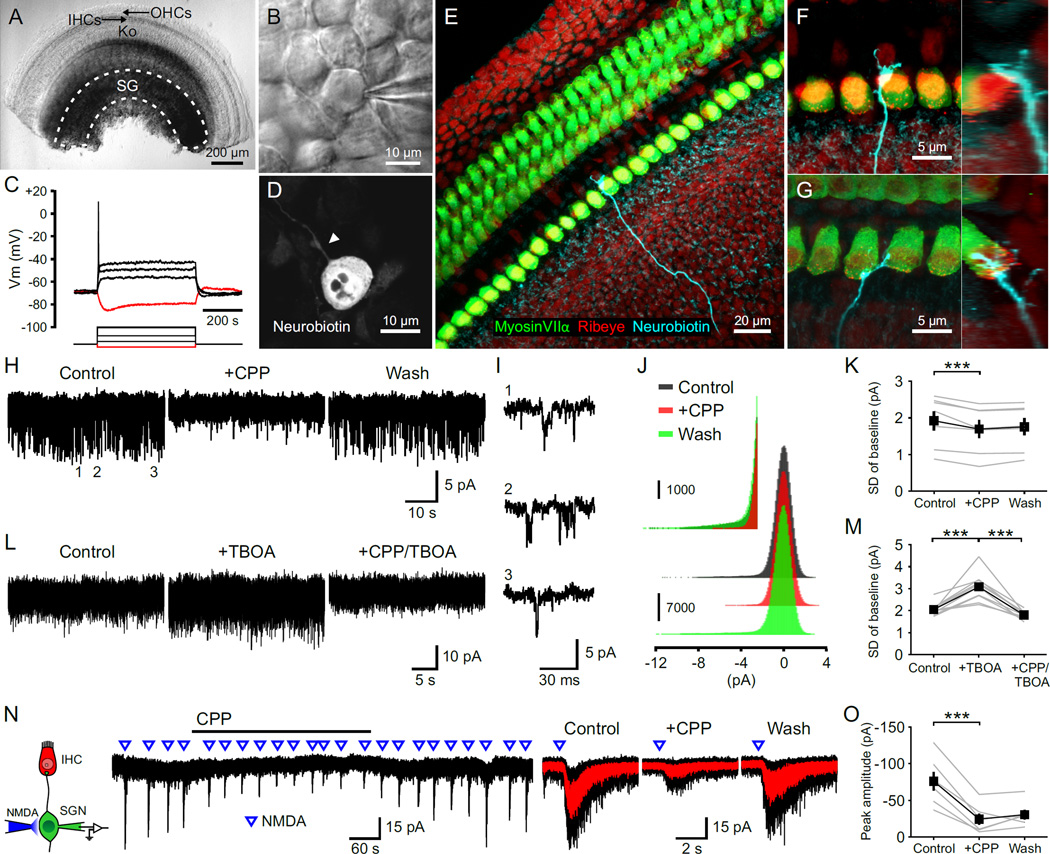
Figure 1. NMDARs Are Expressed by Spiral Ganglion Neurons.
(A) Middle turn of a P5 rat cochlea. Dashed line outlines the spiral ganglion (SG). OHCs, outer hair cells; IHCs, inner hair cells; Ko, Kölliker’s organ.
(B) Somata of a SGN during a juxtacellular recording.
(C) Membrane responses of a SGN to current injections. Red trace, injection of -20 pA; black traces, injections of 20, 60, and 120 pA.
(D) Somata of a SGN filled with neurobiotin during a whole-cell recording. Arrowhead highlights the single dendritic process.
(E–G) Dendrites of SGNs filled with neurobiotin. Orthogonal views are shown to the right. Terminals were located on either the abneural (F) or neural (G) side of IHCs.
(H and L) Baseline noise during whole cell voltage clamp recordings from SGNs in 0 Mg2+ ACSF (Vm = −70 mV). [CPP], 20 µM; [TBOA], 50 µm.
(I) Three examples of individual channel activity from the recording shown in (H).
(J) Amplitude histogram of the baseline noise recording shown in (H). Inset shows the amplitude histogram for inward current fluctuations at an expanded scale.
(K and M) Plots of the standard deviation (SD) of current fluctuations. n = 7 (K) and 10 (M) cells; one-way repeated measures ANOVA followed by Tukey test; ***, p < 0.001. Data show average values from each cell (gray) and mean ± SEM for all cells (black).
(N) Left: Diagram of the recording configuration. Middle: Inward currents triggered by focal applications of NMDA (100 ms, 0.5 mM) in the presence of TTX (1 µM). Right: Average responses to NMDA (red) superimposed on individual responses (black).
(O) Plot of the average peak amplitude of current induced by NMDA in control, + CPP and wash conditions. n = 6 cells; one-way repeated measures ANOVA followed by Tukey test; ***, p < 0.001. Data show average values from each cell (gray) and mean ± SEM for all cells (black).

