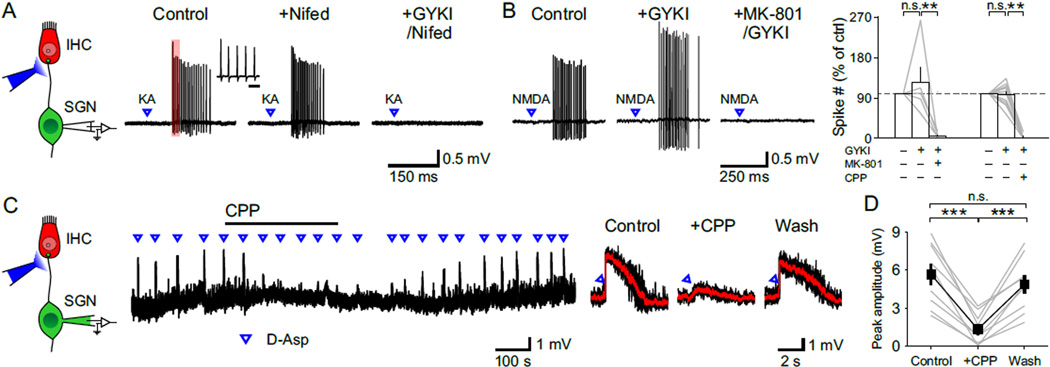
Figure 2. NMDARs Are Present at SGN Dendritic Terminals.
(A) Left: Diagram of the recording configuration. Right: Juxtacellular recording from a SGN showing responses to focal applications of kainate (KA, 10 ms, 100 µM) in control, nifedipine (Nifed, 50 µM) and GYKI53655 (GYKI, 100 µM) + Nifed conditions. Inset shows the first five action potentials in the train (region delimited by red rectangle) at an expanded timescale. Scale bar = 5 ms.
(B) Left: Juxtacellular recording from a SGN showing responses to focal applications of NMDA (10 ms, 1 mM) in control, GYKI and MK-801 (50 µM) + GYKI conditions. Right: Plot of the number of action potentials elicited by NMDA in various drug conditions. MK-801, n = 5 cells, one-way repeated measures ANOVA followed by Tukey test; CPP (20 µM), n = 13 cells, Friedman’s ANOVA followed by Dunn’s test; n.s., not significant, p ≥ 0.05; **, p < 0.01. Data show average values from each cell (gray lines) and mean ± SEM for all cells (white bars).
(C) Left: Diagram of the recording configuration. Right: Whole cell current clamp recording from a SGN showing depolarizations induced by focal applications of D-aspartate (D-Asp, 10 ms, 0.5 mM), an NMDAR agonist, in the presence of TTX (1 µM). Average responses (red) to D-aspartate superimposed on individual traces (black) in control, + CPP and wash conditions are shown to the right.
(D) Plot of the average peak amplitude of depolarization induced by D-aspartate in control, + CPP and wash conditions. n = 9 cells; one-way repeated measures ANOVA followed by Tukey test; n.s., not significant, p ≥ 0.05; ***, p < 0.001. Data show average values from each cell (gray) and mean ± SEM for all cells (black).
See also Figure S1.

