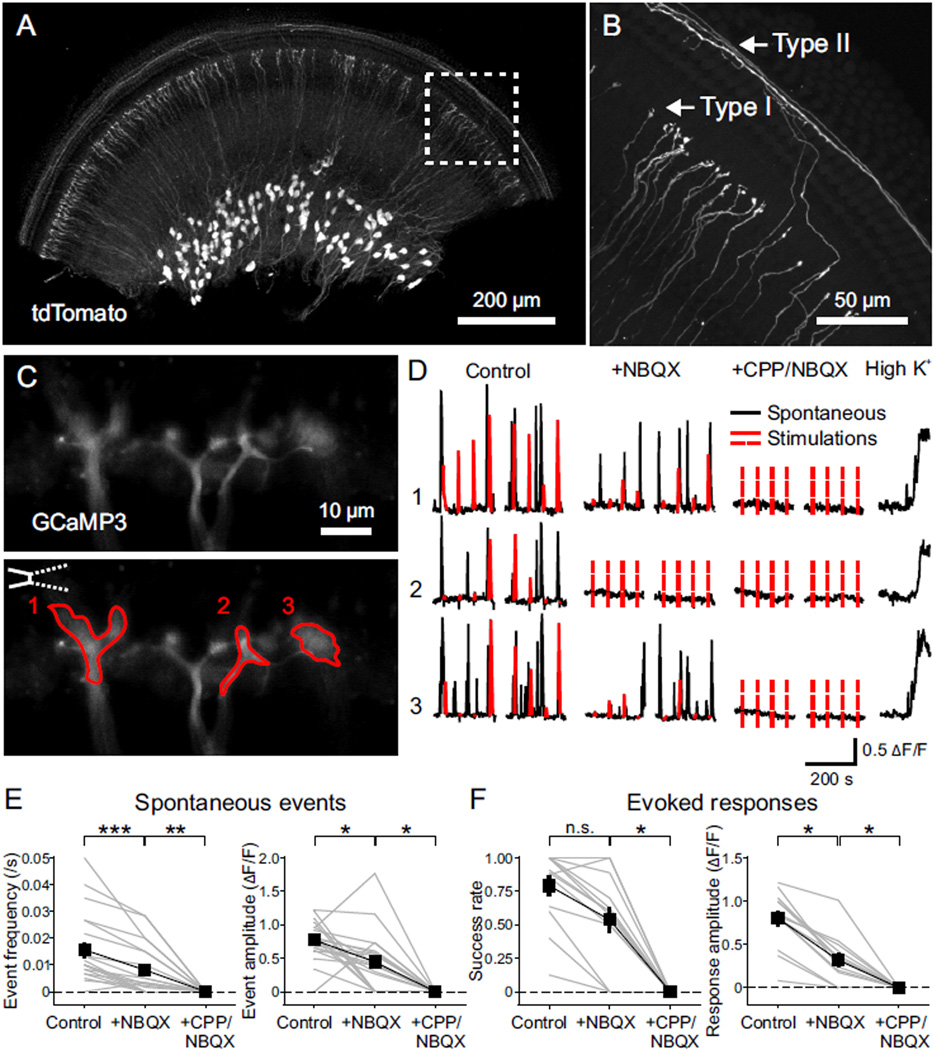
Figure 4. NMDAR Activation Enhances Ca2+ Influx at SGN Dendritic Terminals.
(A) Middle turn of the cochlea from a P7 AvilCre; R26-lsl-tdTomato (termed as AvilCre; tdT) mouse showing expression of tdTomato. Apical direction is to the right.
(B) High magnification image of the area outlined in (A) showing individual dendrites of type I and type II SGNs.
(C) Ca2+ imaging from SGN dendritic terminals. Upper: Maximum intensity projection of individual SGN dendritic terminals near the base of IHCs from the cochlea of a P5 AvilCre; R26-lsl-GCaMP3 (termed as AvilCre; GCaMP3) mouse, over 300 s Ca2+ imaging in the control condition. Lower: Same image showing the placement of a stimulation pipette applying high-sucrose ACSF near IHCs and regions of interest (ROIs) in three dendritic terminals to record Ca2+ signals.
(D) Ca2+ recordings of the ROIs from (C) in control, NBQX (20 µM) and CPP (20 µM) + NBQX conditions. Black traces are spontaneous activity; red traces are responses to stimulations; dashed red lines indicate absence of detectable responses to stimulations. High K+ (10 mM) ACSF was applied at end of the experiment to assess responsiveness of GCaMP3.
(E and F) Plots of spontaneous event frequency and amplitude (E, n = 20 terminals from 12 cochleae) and stimulation success rate and evoked response amplitude (F, n = 13 terminals from 8 cochleae) in control, NBQX and CPP + NBQX conditions. Friedman’s ANOVA followed by Dunn’s test; n.s., not significant, p ≥ 0.05; *, p < 0.05; **, p < 0.01; ***, p < 0.001. Dashed lines indicate 0 values. Data show values from individual terminals (grey) and mean ± SEM for all terminals (black).

