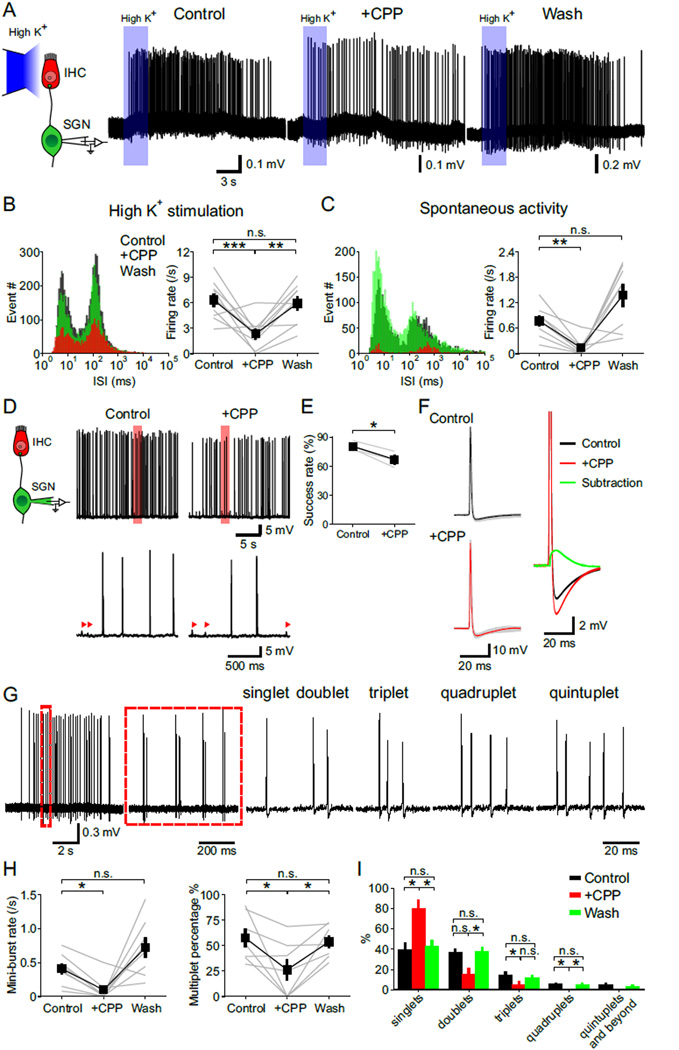
Figure 5. NMDAR Activation Increases SGN Activity and Promotes Repetitive Firing.
(A) Left: Diagram of the recording configuration. Right: Juxtacellular recordings of action potentials from SGNs triggered by local applications (3 s, blue rectangles) of high K+ (10 mM) solution to IHCs. [CPP], 20 µM.
(B and C) Analysis of SGN spontaneous (B) and evoked (C) firing. Left: Log-binned ISI histograms of action potentials in control, + CPP and wash conditions (n = 9 (B) and 8 (C) cells). Right: Plots of the firing rate in control, + CPP and wash conditions. One-way repeated measures ANOVA followed by Tukey test; n.s., not significant, p ≥ 0.05; **, p < 0.01; ***, p < 0.001. Data show average values from each cell (grey) and mean ± SEM for all cells (black).
(D) Left: Diagram of the recording configuration. Right: Whole cell current clamp recording from a SGN showing spontaneous action potentials in control and + CPP conditions. Regions delimited by red boxes are shown at an expanded timescale, with arrowheads highlighting sEPSPs that failed to generate action potentials.
(E) Plot of the success rate of EPSPs reaching firing threshold in control and + CPP conditions. n = 3 cells; paired-sample t test; *, p < 0.05. Data show average values from each cell (grey) and mean ± SEM for all cells (black).
(F) Left: Overlay of individual action potentials (gray, 86 for control and 77 for + CPP condition) and average action potential waveforms recorded in control (black) and + CPP (red) conditions. Right: Subtraction from the two average action potentials showing waveform of the CPP-sensitive depolarization (green).
(G) Temporal pattern of SGN firing within spontaneous bursts. Left: Juxtacellular recording of a spontaneous burst of action potentials from a SGN. Region highlighted by the dashed red line is shown to the right at an expanded timescale. Right: Examples of mini-bursts consisting of varying numbers of action potentials recorded from the same SGN.
(H) Plots of the mini-burst rate (n = 8 cells) and percentage of mini-burst events (n = 7 cells) that contained more than one action potential (multiplets) during spontaneous activity in control, + CPP and wash conditions. One-way repeated measures ANOVA followed by Tukey test; n.s., not significant, p ≥ 0.05; *, p < 0.05. Data show values from individual cells (grey) and mean ± SEM for all cells (black).
(I) Graph of the percentage of spontaneous mini-bursts containing different numbers of action potentials recorded in control, + CPP and wash conditions. n = 7 cells; one-way repeated measures ANOVA followed by Tukey test for quantification of singlets, doublets and triplets, and Friedman’s ANOVA followed by Dunn’s test for quantification of quadruplets and quintuplets and beyond; n.s., not significant, p ≥ 0.05; *, p < 0.05. Data show mean ± SEM for all cells.
See also Figures S6 and S7.

