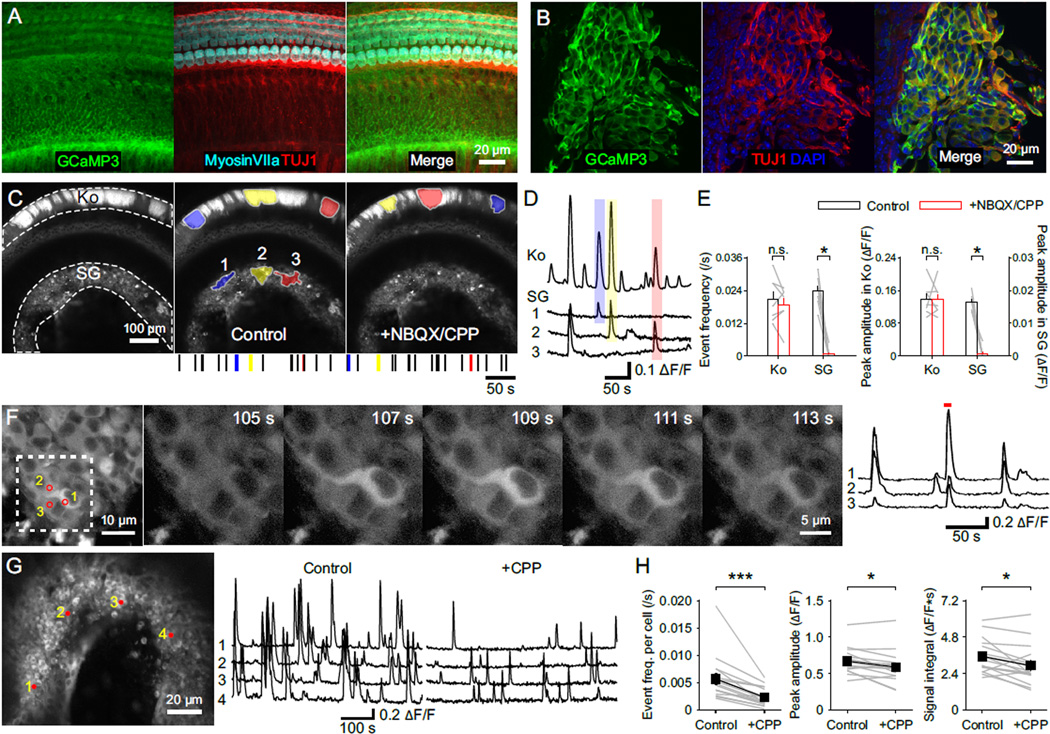
Figure 6. NMDAR Activation Enhances Spontaneous Activity in Individual Spiral Ganglion Neurons.
(A and B) Inner sulcus (A) and spiral ganglion (B) of the cochlea from a P5 Pax2-Cre; R26-lsl-GCaMP3 mouse.
(C) Imaging of spontaneous Ca2+ transients in the cochlea of a P6 Pax2-Cre; R26-lsl-GCaMP3 mouse. Left: Maximum intensity projection of fluorescence changes in the control condition recorded continuously for 300 s. Middle: Maximum intensity projection image overlaid with maximum activated area of three spontaneous events that appeared in both Kölliker’s organ (Ko) and the spiral ganglion (SG). A raster plot indicating the timing of spontaneous events in Kölliker’s organ is shown at the bottom, with the three examples shown above highlighted by their corresponding colors. Right: Maximum intensity projection of fluorescence changes for 300 s in NBQX + CPP (both at 20 µM), overlaid with maximum activated area of three spontaneous events that appeared in Kölliker’s organ. A raster plot indicating the timing of spontaneous events in Kölliker’s organ is shown at the bottom, with the three examples shown above highlighted by their corresponding colors.
(D) Intensity versus time plot for GCaMP3 fluorescence in Kölliker’s organ (Ko) and regions of SG shown in (C) with the three spontaneous Ca2+ transients in the control condition (C, Middle) highlighted with their corresponding colors.
(E) Plots of spontaneous Ca2+ event frequency and peak amplitude of Ca2+ transients in Kölliker’s organ and the spiral ganglion in control (white) and NBQX + CPP (red). n = 7 cochleae; paired-sample t test for Kölliker’s organs and paired-sample Wilcoxon signed ranks test for spiral ganglia; n.s., not significant, p ≥ 0.05; *, p < 0.05. Data show average values from each cochlea (grey lines) and mean ± SEM for all cochleae (bars).
(F) Ca2+ imaging from individual SGN somata. Left: Maximum intensity projection of fluorescence changes in the spiral gangion from a P5 Pax2-Cre; GCaMP3 mouse recorded for 300 s. Numbered circles show regions of interest (ROIs) used for fluorescence intensity measurements at right. Middle: Individual images for the area delineated at left (dashed white square) at higher magnification showing a Ca2+ transient in SGN somata. Right: Intensity versus time plot for the three SGN somata highlighted at left. Red line highlights the Ca2+ transient illustrated in the individual images (Middle).
(G) Ca2+ imaging of spontaneous activity in the whole spiral ganglion. Left: Maximum intensity projection image of fluorescence changes in the spiral ganglion from a P4 Pax2-Cre; GCaMP3 mouse recorded for 300 s in the control condition. Numbered circles show ROIs used for fluorescence intensity measurements. Right: Intensity versus time plots for the four SGN somata shown at left in control and + CPP (20 µM) conditions.
(H) Plots of the spontaneous event frequency per neuron, the peak amplitude and integral of individual Ca2+ events in control and + CPP conditions. n = 16 cochleae; paired-sample t test; *, p < 0.05; ***, p < 0.001. Data show average values from each cochlea (grey) and mean ± SEM for all cochleae (black).
See also Movie S2.

