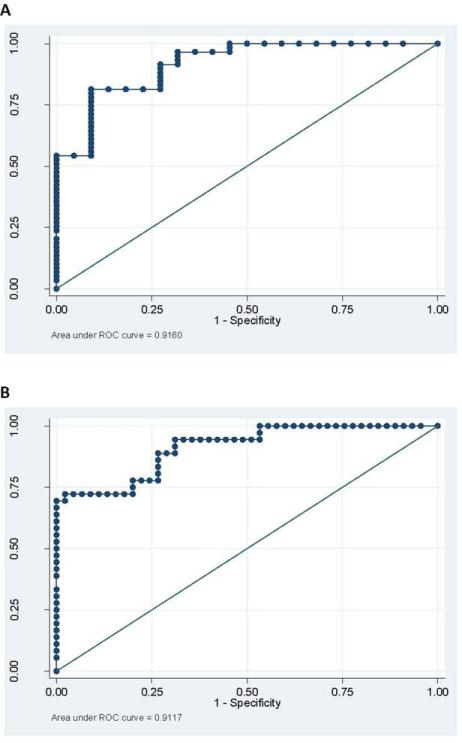
FIG. 4.
ROC curves for the distinction between intact subjects and those with either dementia or MCI (A) and for the distinction between intact/MCI subjects and those with dementia (B). The area under the ROC curve for the distinction between intact and MCI/dementia is 0.92 (95% confidence interval [CI]: 0.85–0.98), and the area under the ROC curve for the distinction between intact/MCI and dementia is 0.91 (95% CI: 0.85–0.97). [Color figure can be viewed in the online issue, which is available at wileyonlinelibrary.com.]

