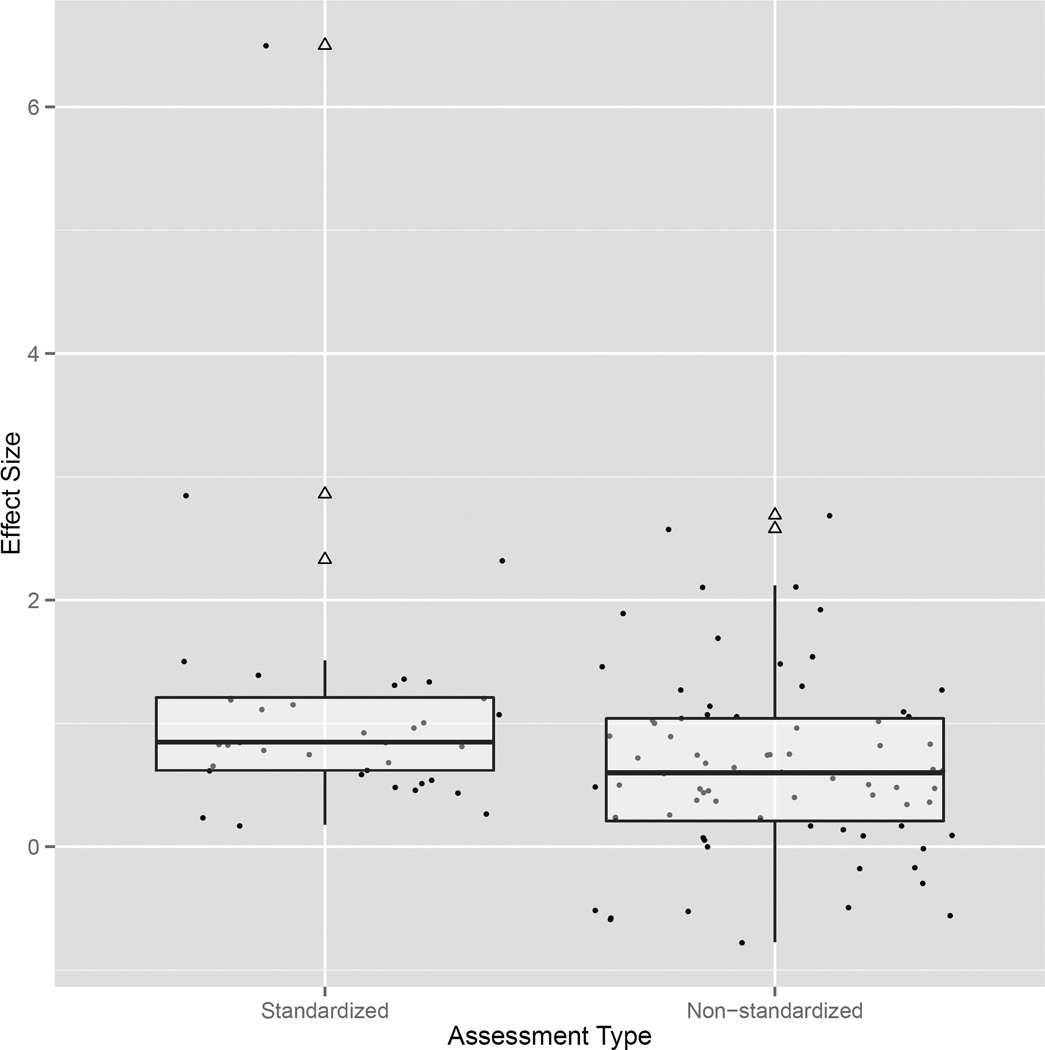
Figure 2.
Distribution of effect sizes for all standardized and non-standardized comparisons. The boxplots provide the interquartile range of each effect size for both assessment types. The bold horizontal line in the center of each box provides the median effect size. Hollow triangles represent outlying effect sizes and correspond to neighboring points on the plot.

