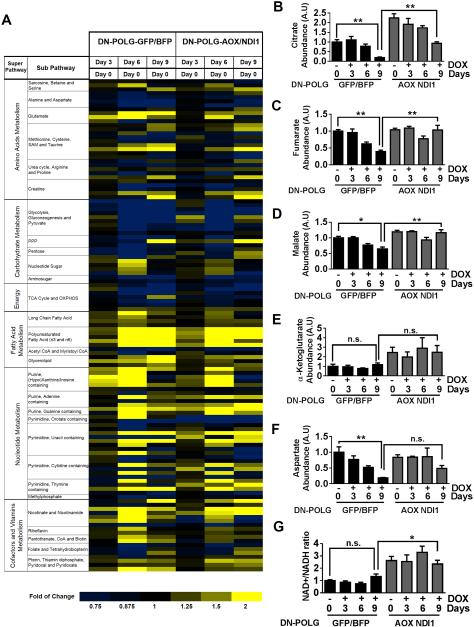
Figure 4. NDI1 and AOX expression in inducible mtDNA depleted cells restores the levels of TCA cycle metabolites.
(A) The heat map displays the fold of change in metabolites involved in important metabolic pathways in DN-POLG-GFP/BFP and DN-POLG-AOX/NDI1 cells treated with doxycycline (10 ng/ml) for 3, 6 and 9 days relative to untreated cells. A yellow-blue color scale depicts the abundance of the metabolites (Yellow: high, Blue: low). Data represent the average of 4 independent experiments.
(B-G) Intracellular citrate (B), fumarate (C), malate (D), α-Ketoglutarate (E), aspartate (F) levels and NAD+/NADH ratio (G) in DN-POLG-GFP/BFP and DN-POLG-AOX/NDI1 cells untreated or treated with doxycycline (10 ng/ml) for 3, 6 and 9 days. Mean ± SEM (n=4).
* indicates significance p < .05. ** indicates significance p <0.01 throughout figure 4. See also Figure S4.

