
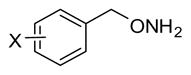
Table 3.
Inhibition Data for Monoaryl Hydroxylamines with Ring Substitutiona
| ||||||||
|---|---|---|---|---|---|---|---|---|
| Compd | X | IC50(μM) | Compd | X | IC50(μM) | Compd | X | IC50(μM) |
| 8 | 4-I | 0.22± 0.066 | 16 | 3-F | 1.0 | 24 | 2-OCH3 | 5.4 |
| 9 | 3-Cl | 0.30± 0.015 | 17 | 4-Cl | 1.3 | 25 | 4-CF3 | 8.9 |
| 10 | 3-Br | 0.32± 0.042 | 18 | 2-F | 1.4 | 26 | 3-OCH3 | 9.5 |
| 11 | 3-I | 0.34± 0.12 | 19 | 4-Br | 1.6 | 27 | 4-Ph | 12 |
| 12 | 3-CF3 | 0.41 | 20 | 2-Br | 1.6 | 28 | 4- CH(CH3)2 | 15 |
| 13 | 2-I | 0.57 | 21 | 2-CF3 | 2.5 | 29 | 2-OH | 19 |
| 14 | 2-Cl | 0.63 | 22 | 3-CH3 | 2.7 | 30 | 4-OCH3 | 24 |
| Lead | H | 0.81±0.081 | 23 | 4-NO2 | 2.7 | 31 | 4-OH | 61 |
| 15 | 4-F | 0.98 | ||||||
a
IC50 values are based on single point inhibition curves run once for each compound, but repeated at least 2x for the most potent compounds (initial IC50 values below 0.4 μM). These results are reported as the averages ± SD.